Regional disparities persist in future wind capacity growth
Wind power is expanding worldwide – but not evenly. Behind the global rise of wind lies regional disparities, shaped by policy, infrastructure, and market design.
Why are some regions pulling ahead?
Today, the global wind landscape is highly concentrated with 83% of capacity sitting in just three regions (North America, Europe, and Greater China). China leads decisively in scale, while Europe’s installed capacity is half that of China despite strong technical capabilities and supportive policies. North America has the third largest wind capacity, but the sector faces uncertainty in the short and medium term due to the hostile policy position of the current US administration. Other regions remain marginal players, despite ample wind potential.
Policy determines pace
Europe leads globally in terms of share of electricity generated from wind, expected to reach 27% by 2040. Europe’s steady onshore growth and quick offshore growth is thanks to stable and coordinated policy frameworks. Mechanisms such as contracts of difference (CfDs) reduce the financial risk and attract investment, while the EU emissions trading system (ETS) raises the cost of fossil alternatives. Together, this creates a predictable investment environment.
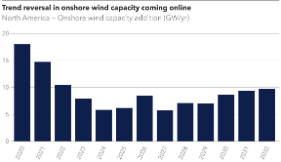
In contrast, North America illustrates how policy uncertainty can slow progress despite strong fundamentals. Following a peak in installations in 2020, onshore wind deployment has declined, affected by shifting policy signals, permitting challenges, and competition with solar. For offshore wind in particular, inconsistent auction outcomes and changing political priorities have increased risk and slowed project development. Under the current policy environment, meaningful growth is unlikely in the short to medium term.
Grids determine limits
As wind deployment increases, the main constraint shifts from generation to integration. New connection requests are piling up and waiting times to connect to transmission grids have doubled or trebled over two decades. In the US, the median delay is five years; in Europe, some projects need to wait over a decade.
Grid bottlenecks are already visible in future deployment outcomes as we forecast Europe underperforming its 2030 wind capacity ambition of > 400 GW. Without grid constraints, our model shows that wind capacity could be 8% higher in Europe, 10% in North America, and 14% in OECD Pacific by 2035.
Grid bottlenecks are not universal. China expanded rapidly through strong central planning and domestic transformer supply. Ultra-high voltage lines link remote renewables to demand centres, avoiding many delays seen in Europe and North America. However, China is not completely immune to integration challenges. Inflexible grid management and rising curtailment are leading to significant volumes of wind and solar generation being wasted, contributing to a recent rebound in emissions despite record renewable build-out (Myllyvirta, L.,2026).
Industry determines scale
Greater China dominates global wind capacity, with over 600 GW installed today and continued rapid growth is expected towards 2040. This scale is underpinned by strong domestic manufacturing, mature supply chains, and consistent state support.
China’s cost advantage is particularly visible in turbine pricing, driven by intense domestic competition and production overcapacity. Combined with lower labour and land costs, this results in significantly lower levelized costs of energy compared with Europe and North America.
By 2040, Greater China’s total fixed offshore wind capacity alone is projected to exceed three times that of the next three highest capacity regions combined (Europe, North America, OECD Pacific).
For further analysis, download our Energy Transition Outlook 2025 report, or deep dive into the forecast for the Greater China region, the North America region, or Europe.