Are Paris goals achievable? How the energy transition measures up against climate targets
DNV’s Energy Transition Outlook 2025 reveals a huge gap between projected emissions and net-zero by 2050, with all regions falling short of their climate pledges. Even Europe, the frontrunner, gets close but misses net zero by 14 years. What will it really take to close the gap? We examine the case in Europe and find that bolder action would have significant positive ripple effects worldwide.
Lead authors: Onur Özgün and Anne Louise Koefoed
Contributors: Aasta Andreassen and Adrien Zambon
In this article, we compare climate targets against emission levels forecast in DNV’s Energy Transition Outlook 2025 (ETO 2025). We project Europe to be the first region to reach net zero and examine how it can close the gap to reach the target by 2050.
Although Europe has just taken a small step backwards by allowing a greater percentage of emissions to be offset through international carbon credits (from 3% to 5%) to balance competitiveness with climate goals – long-term independence, security, and decarbonization still pull in the same direction. Europe continues to demonstrate global leadership through regulatory stability among 27 member states, and it is a trailblazer in its whole-system approach, mixing policy instruments that both support and mandate transformation and price carbon to discourage emissions. This comprehensive approach provides insights for other regions navigating the transition, and we show here why bolder steps would pay off for Europe and contribute to faster and cheaper transitions elsewhere.
Factors helping and hindering Paris Agreement goals
This year, countries are expected to submit more ambitious nationally determined contributions (NDCs) covering planned reductions from 2030 to 2035. However, climate diplomacy faces growing challenges, including geopolitical tensions that strain multilateral cooperation, rising tariffs that increase cleantech costs, and limited commercially viable decarbonization options in hard-to-decarbonize, trade-exposed sectors. Climate action is sidelined by other socioeconomic priorities, and NDC updates – critical for COP30 – have been slow and lacked sufficient ambition.
By mid-October, only 62 countries (31% of global emissions) had submitted updates according to ClimateWatch. Major economies, like India and the EU have yet to submit their official NDCs. China submitted its NDC on 3 November, targeting a cautious 7-10% cut from peak emissions by 2035, but some sectoral and non-CO₂ gas reductions remain less developed, including policy details on coal phase-down. Meanwhile, the US exited the Agreement, rolled back federal climate policy, reduced international donor funding for climate, which all weaken global momentum at a critical time.
On the other hand, climate action can gain impetus for its economic benefits: renewables are now cheaper than fossil fuels in new power generation, supporting wider electrification and transformation in several demand sectors; competition for new industrial growth is spurring economic benefits, innovation, and jobs; and energy security concerns, intensified by volatile fossil fuel prices, are accelerating a shift to domestic renewables – especially in import-dependent countries. Global policy is amplifying these trends. For example, the New Collective Quantified Goal on Climate Finance (NCQG), adopted at COP29, aims to triple climate finance to developing countries to USD 300 billion annually by 2035, although the financing model and flow of funds are to be worked out.
Arguably, COP30 in Belém does not need comprehensive new government-negotiated outcomes given what is already agreed, such as COP28’s Global Stocktake outcome and clear implementation priorities for energy in paragraph 28 on mitigation. But COP negotiations remain crucial to drive global action toward a ‘well below 2°C’ world. The 2025 Nationally Determined Contributions Synthesis Report, covering one-third of global emissions, projects a 10% cut in greenhouse gas emissions (GHGs) from 2025 levels and 17% from 2019 levels by 2035 – bending the emissions curve but far short of the 60% reduction outlined by the IPCC in 2023. The UN Emissions Gap Report 2025 sees slight improvement but still warns of a 2.8°C rise based on current policies and 2.3-2.5°C if NDCs are implemented in full. DNV’s ETO 2025 projects a most likely 2.2°C increase by 2100 due to emissions overshoot, which is why deeper and speedier cuts are needed. NDCs remain vital tools to align energy investments with climate goals.
How likely is it that regional climate targets will be achieved?
At DNV, our ETO 2025 offers a deep dive into the energy trajectories of ten world regions, also using CO2 emissions as a lens to track progress. The picture we paint is sobering: despite bold pledges and long-term climate ambitions communicated in the NDCs or long-term low emission development strategies (LT-LEDS), every region is falling short on emissions reductions. In 2024, global annual energy-related CO2 emissions hit 35 gigatonnes (Gt), with an additional 3.4 Gt from industrial processes beyond fuel combustion. Fast forward to 2050, and we project a 43% drop, bringing total emissions down to just under 22 Gt – a significant decline, yet still far from the CO2 cuts needed to meet climate targets (99% for 1.5°C and 73%, below 2019 levels, for well below 2°C in line with IPCC, 2023).
Our ETO 2025 finds power generation leading CO2 emission declines, followed by the transport sector (see Figure 1), which reflects the findings of the 2025 NDC Synthesis Report (Figure 17, p. 43). That report finds that most NDCs refer to mitigation measures in energy supply (80%), particularly solar and wind as priority areas, followed by transport (78%), particularly electric (light and heavy) vehicles, while fewer NDCs include mitigation measures in buildings (69%) and Industry (67%).
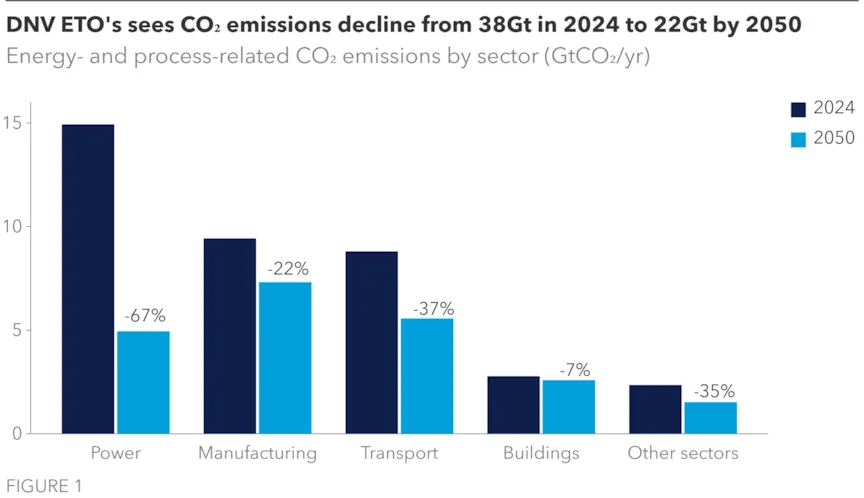
Note: Decarbonizing energy and industry is key, with the energy sector accounting for about 75% of global greenhouse gas emissions and industrial process emissions adding another 6% (WRI, 2024).
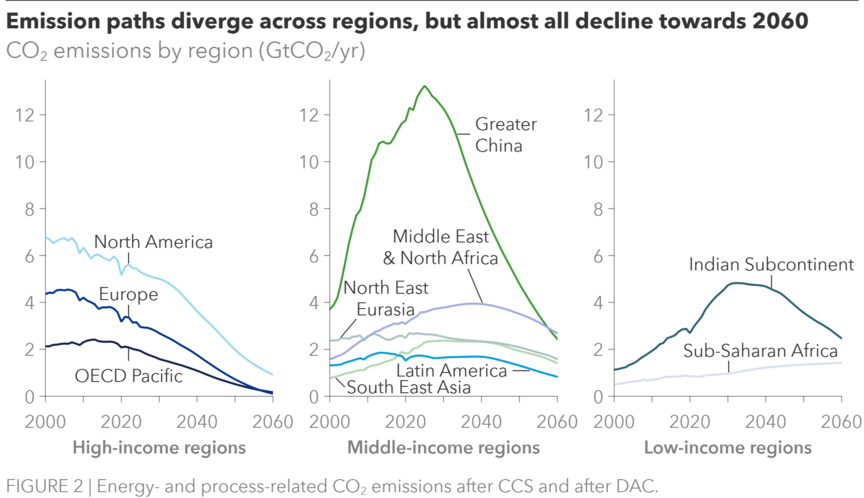
Figure 2 shows regional emission trajectories grouped by income level, recognizing and reflecting levels of and aspirations for development and industrialization.
Decarbonization is happening, but far too slowly. Overall, emission reductions projected in the ETO 2025 are off track to meet goals set in NDCs and LT-LEDS across all regions, as shown in Figure 3 below. The Appendix table details the climate targets of ten world regions1 and ETO 2025 covers their transitions in detail. Select regional findings on emission trajectories include:
- Greater China: A modest NDC pledge of 7-10% reduction from peak levels confirms the direction in Chinese policies towards emissions control. China commonly under promises and overdelivers, enabled by its booming cleantech sector. However, on carbon neutrality by 2060, our analysis finds residual emissions, mostly from hard-to-decarbonize subsectors in manufacturing and transport (aviation and maritime).
- North America: Canada maintains net-zero goals for 2050. However, US policy shifts in 2025 extend fossil fuel use and limit green hydrogen and electric mobility, delaying decarbonization by five to eight years. Despite reduced support, solar and onshore wind expand as the cheapest sources of electricity. Nonetheless, emissions remain well above net zero by 2060.
- In the Indian Subcontinent, where India is the dominant economy, energy addition is essential to meet increasing energy demand, and economics drive energy decisions. Falling renewable costs keep clean electricity a priority, though coal remains for energy security reasons. Climate targets aim to limit emissions growth, and the emissions peak in the early 2030s is promising for net-zero trajectories, including India’s goal to be carbon neutral by 2070.
1 DNV forecasts the energy transition globally and in 10 world regions, including the energy trade between regions.
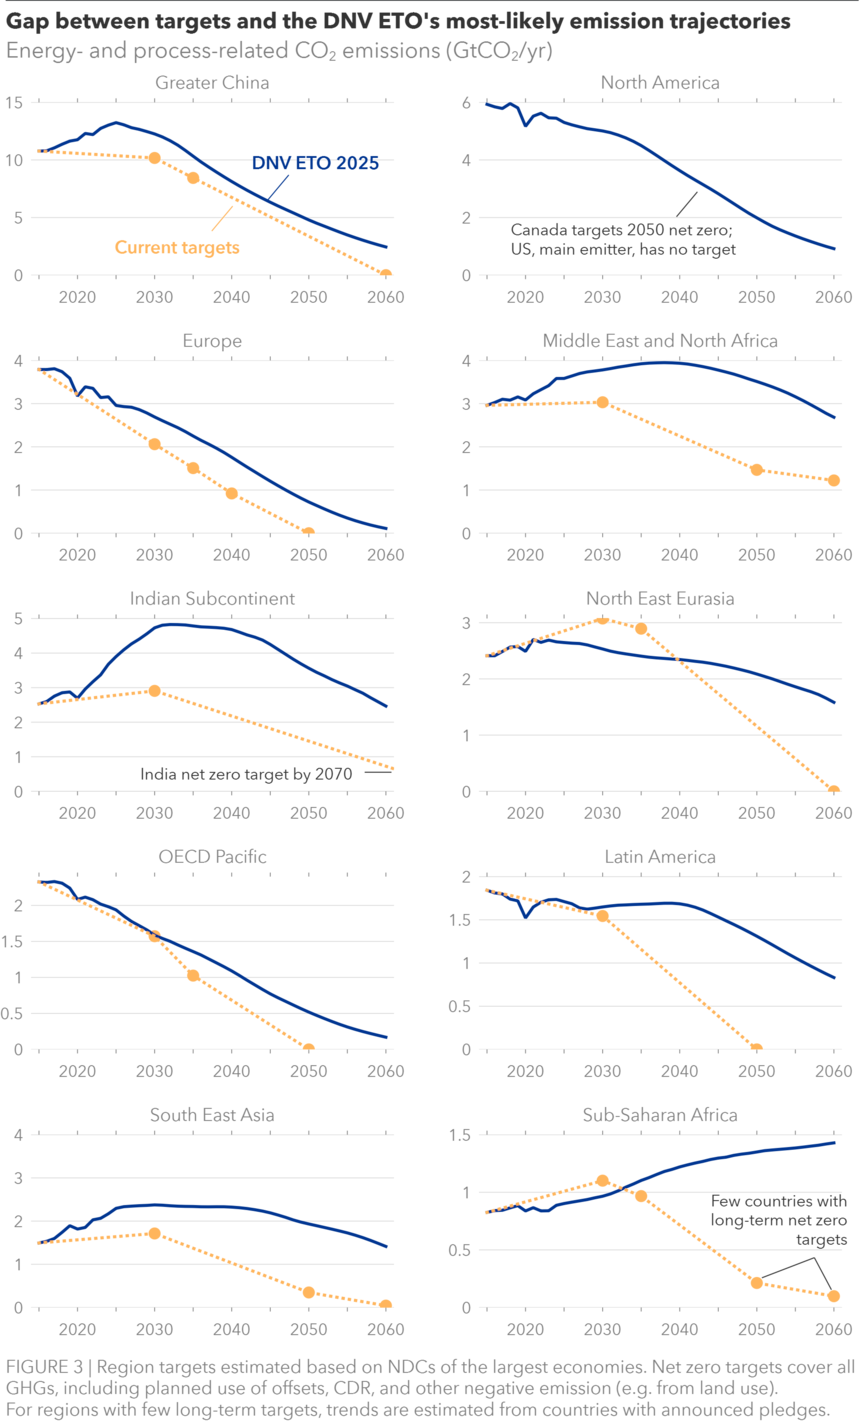
In the table in the Appendix, we summarize our comparison of average regional emission reduction targets and present ETO forecast reductions, emphasizing 2050 or 2060, depending on announced targets.
No region is doing enough even to meet their own pledges, leaving the world far short of net zero, with global emissions remaining net-positive well into the second half of the century. Yet progress is uneven. Europe leads the pack, but even it reaches net zero only by 2064 in our forecast. If the frontrunner arrives 14 years late, what does that imply for the rest of the world? More importantly, what would it take for Europe to close the gap and reach net zero by 2050, and how would that shift influence others?
Where is Europe headed and what is needed to reach net zero by 2050?
In the ETO 2025, we forecast that Europe will become the first region to reach net-zero energy- and process-related CO₂ emissions. This milestone will be reached in 2064 through a combination of reduced fossil fuel dependency in all sectors, CCS in hard-to-decarbonize sectors, and additional carbon dioxide removal (CDR). Although EU policy now targets 50 Mt/yr CO₂ storage capacity by 2030 and 450 Mt/yr captured by 2050, we only forecast 350 Mt/yr by 2050.
Europe’s path to net zero relies on policies few others have dared to test. Germany and the Netherlands are pioneering Carbon Contracts for Difference, guaranteeing a carbon price for green steel and cement. At the household level, policies such as Germany’s 65% renewable heating rule shows how Europe is extending the transition from factories to front doors. Europe is also creating a market for carbon removals, with Sweden’s BECCS auctions and Denmark’s CCS Fund paying for verified tonnes of CO₂ stored. Meanwhile, the EU Taxonomy requires financial institutions to disclose exposure to high-carbon assets. Not all efforts have worked – the early ETS oversupply and weak efficiency targets showed the price of learning – but Europe’s readiness to experiment keeps it ahead.
In our forecast of the most likely energy future, Europe’s sectoral emissions fall at different speeds (Figure 4) because its systems have different kinds of inertia. Power changes fastest because investment cycles are short, technologies are mature, and policy is direct: shut coal, build renewables, connect grids. Industry follows once carbon prices bite hard enough to make electrification (direct or indirect through hydrogen) and capture viable. Transport moves faster than expected thanks to the rapid electrification of road vehicles, but aviation and shipping remain slow to shift despite fuel mandates (ReFuelEU for SAF in aviation and FuelEU Maritime). Buildings are the real drag: boilers last 15 years or more and retrofits disrupt daily life. By 2050, Europe will have cut deeply but not sufficiently. What’s left of emissions is less about physics than politics; how much disruption governments are willing to accept in people’s homes, habits, and wallets.

Although 740 Mt of emissions in 2050 marks a steep decline from 1990 levels, closing the remaining gap is far harder than the numbers suggest. The last tonnes are the most expensive and intrusive to remove. Getting to net zero by 2050 rather than 2064 would mean intervening in natural replacement cycles, forcing retrofits, accelerating bans, and tolerating sharper rises in energy and consumer costs. These are not marginal adjustments but visible disruptions to daily life – flights, heating, food, commuting. Politically, that is where climate ambition tests voter patience and acceptance. Technically, too, the challenge hardens: you cannot capture carbon from a jet in flight or retrofit every home overnight. The final slice of emissions cuts will demand not just innovation, but discomfort.
The table below outlines the additional policy measures needed to bring Europe’s net-zero date forward to 2050. This represents just one of several plausible pathways, where choices extend far beyond minimizing total cost. Each option must balance competing aims: the scale and timing of upfront investment, the distribution of costs between households and industry, the risk of carbon leakage, and the preservation of Europe’s industrial competitiveness. Equally, policies must consider the political limits of disruption and the strategic gains of building early leadership in clean technologies. The right mix will not simply depend on economics but on how Europe manages fairness, speed, and sovereignty in the final phase of decarbonization.
|
Policy |
Most likely future |
Net zero by 2050 |
|
Carbon price |
$230/t by 2050 |
$450/t by 2050 (with earlier coverage of buildings in ETS-2) |
|
Taxes and levies on electricity price |
16% VAT (households) + $40-50/MWh levies + capacity payments up to 7% of end use price |
Levies moved to natural gas by 2035. No capacity payments |
|
Buildings retrofit rate |
1.25/yr in line with energy performance standards |
2.5/yr by 2040 |
|
Heat pump subsidies |
Avg. around $1000/kW, until cost parity with gas boiler is reached |
Avg. around $1500/kW, continued support until much of the existing stock is replaced |
|
EV subsidies |
5-7% of vehicle price with a decline as price drops |
8-10% of vehicle price with a decline as price drops |
|
Hydrogen support |
25-50% CAPEX support declining towards 2050 for green hydrogen, CfDs for European Hydrogen Bank |
Sustained 25-50% CAPEX support with additional $1/kg OPEX support for green hydrogen |
|
CCS support |
CCS support grants and contracts covering 30–70% of capture + storage costs, reducing as cost decline |
Additional support up to $80/t for industries with large process emissions |
What are the implications of Europe reaching net zero by 2050?
Shifting levies from electricity to gas would overturn old incentives and supercharge electrification across homes and factories. But a USD 450/t carbon price would also test Europe’s heavy industry. For some sectors, it is a tailwind, for others, a reckoning. Aluminium and fertilizer producers could gain from cheaper, cleaner power, while cement, steel, and chemicals would face sharper cost pressures and tougher investment choices.
The Carbon Border Adjustment Mechanism offers partial protection by charging imports for their carbon content, levelling the economic playing field for steel, cement, and fertilizer. Yet that shield stops at the border. Exporters of cars, machinery, and chemicals must still compete in markets with no carbon price. Stronger CCS and hydrogen support – such as Germany’s green-steel projects or the Netherlands’ Porthos cluster – can cushion the blow, but a 2050 net-zero sprint would still strain margins and patience.
In buildings, the shift is simpler but just as profound. Faster heat pump deployment raises their share from 39% to 60% of households by 2050, cutting natural gas use in homes from one-fifth to a tenth of total energy demand. Energy spending changes shape rather than size: households pay less for fuel and more for clean power and efficient systems, with total annual costs per household falling from about USD 5,000 today to USD 3,500 by mid-century. Europe’s building transition is not about paying more; it is about paying smarter.
On the supply side, deeper electrification and renewables would trim Europe’s fuel import dependency from 56% today to 31% by 2050, compared with 35% in the most likely future. That shift means fewer energy shocks, less price volatility, and greater strategic confidence; the quiet dividends of a faster transition. But the benefits reach further. A more electrified, efficient energy system would stabilize household and industrial energy bills by insulating Europe from global fuel price swings. It would keep more value within domestic borders, create high-skill jobs across supply chains, and strengthen Europe’s balance of trade. By accelerating, Europe does not just pay earlier – it pays differently: less for fossil imports, more for assets that yield long-term resilience.
Faster decarbonization would also give Europe first-mover advantage in shaping the next generation of energy markets. Smarter tariffs could protect basic consumption while rewarding flexibility, and better-designed capacity and carbon markets could guide investment where it matters most. Tackling real pinch points – from grid bottlenecks and transformer shortages to slow permitting and a lack of skilled workers – would bring greater returns than another round of subsidies. Europe’s edge has never been cheap energy but clever institutions. Leading this phase means innovating not only in technology, but in how its markets and policies work.
How could Europe reaching net zero help the rest of the world?
Bringing Europe’s net-zero date forward to 2050 would ripple far beyond its borders. Global CCS deployment would rise by nearly 30%, driving down capture costs by around 5% as European projects expand supply chains, build expertise, and prove business models. Heat pumps would follow the same learning curve logic, falling roughly 4% in cost by 2050 as manufacturing scales and European demand anchors global production. Together, these effects would trim emissions in the rest of the world by about 5%.
The largest additional emission reductions appear in North America with 14%, where similar market structures, capital access, and technology supply chains make European practices quick to take hold. Impacts are smaller in Greater China (1.5%) and the Indian Subcontinent (4%) because local energy mixes, slower policy change, and protectionist industrial strategies limit direct uptake of European practices. In OECD Pacific, stronger policy alignment and import dependence amplify the emission reduction benefits (around 9%).
Beyond technology learning, faster European decarbonization could have quieter but powerful spillovers: lower global equipment prices, greater investor confidence in clean infrastructure, and new standards for carbon accounting and trade. In short, Europe’s early action would not just clean its own energy system – it would bend global cost curves and set the pace for everyone else.
Appendix
|
Region |
Details on regional CO2 emissions reduction targets and ETO forecast* |
|
Greater China (dominated by China) |
ETO findings*:
|
|
North America (dominated by the US) |
ETO findings*
|
|
Indian Subcontinent (dominated by India) |
ETO findings*
|
|
Middle East & North Africa |
ETO findings*
|
|
Europe |
ETO findings*
|
|
North East Eurasia |
ETO findings*
|
|
South East Asia |
ETO findings*
|
|
OECD Pacific |
ETO findings*:
|
|
Latin America |
ETO findings*:
|
|
Sub-Saharan Africa |
ETO findings*:
|
|
*Energy- and process-related CO2 emissions (after CCS and after DAC) |
|
Note: Country NDCs differ in their treatment of land-use emissions (AFOLU/LULUCF), target formats (fixed levels, base year references, or business-as-usual scenarios), and whether reductions are conditional on international support. To enable consistent cross-country comparison, we estimate unconditional emission reduction targets from 1990, excluding LULUCF, using Climate Action Tracker and the UNFCCC NDC Registry. We focus on major economies representing 80% of each Outlook region’s energy use, aggregating country-level data by GDP share to derive regional targets.
Back to main article
11/12/2025 8:33:00 AM