UK and Ireland windiness 2025: Slightly lower than long-term averages

What are the implications for you?

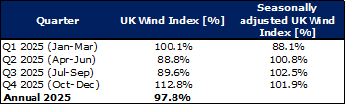
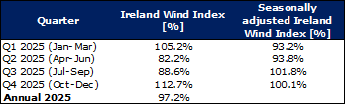
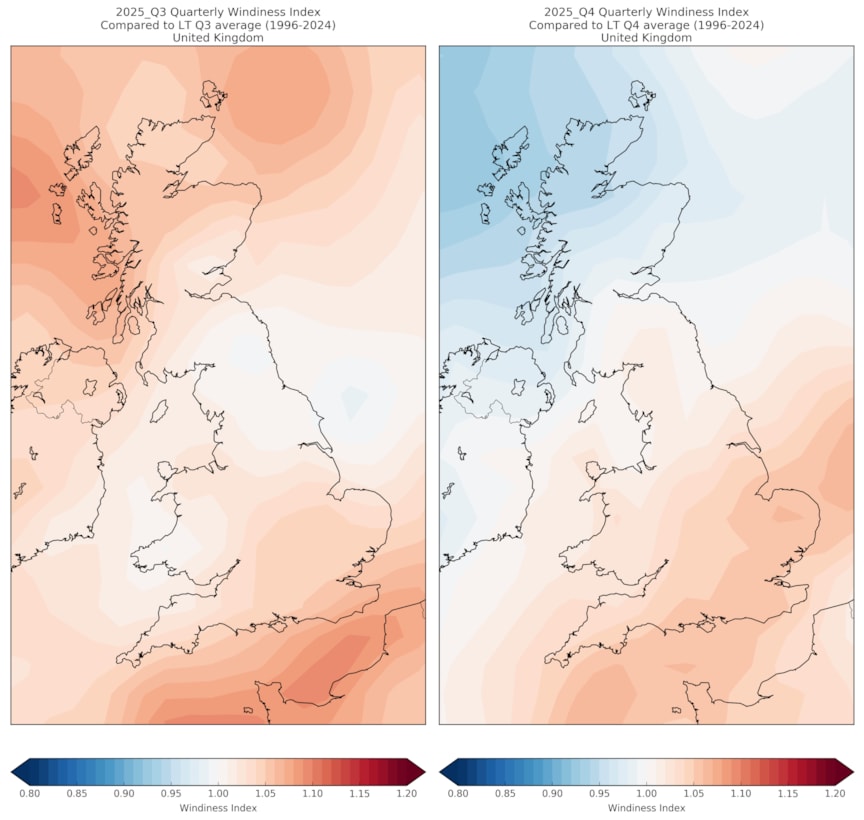
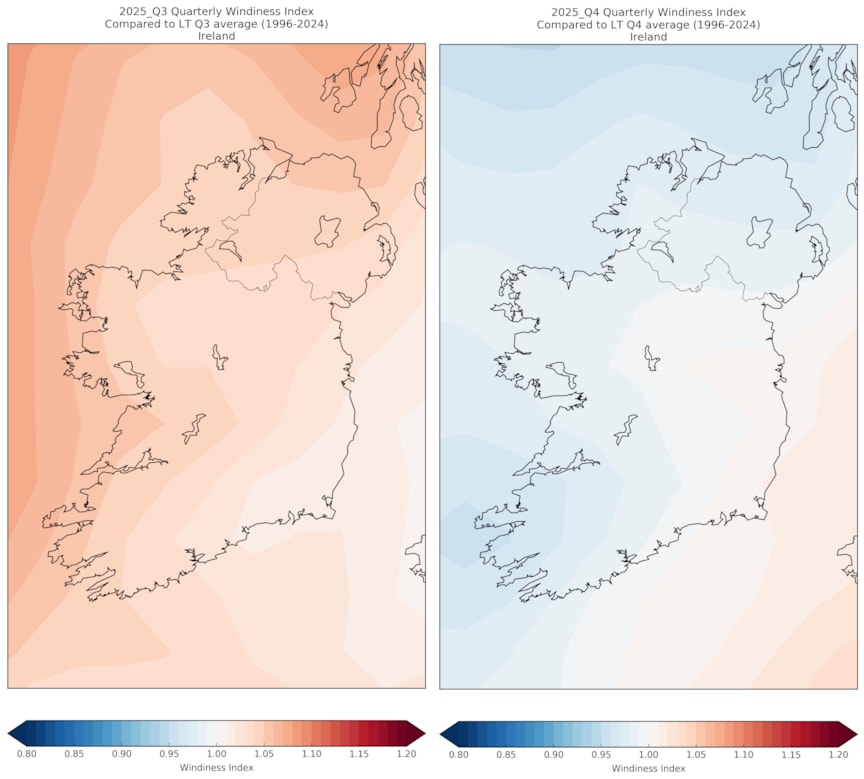
Monitoring and recording wind speed trends can provide valuable insights for assessing project performance. 2025 brought slightly below-average wind speeds across the UK and Ireland, despite windier than normal conditions through Q3. Explore DNV analysis of monthly trends, regional patterns and what that means for the performance of your assets.

2025 wind speed trends

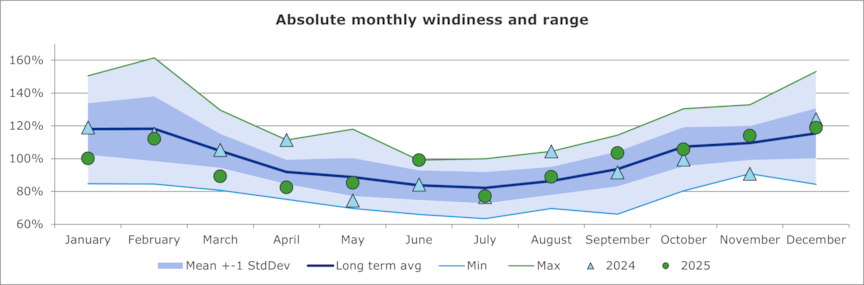
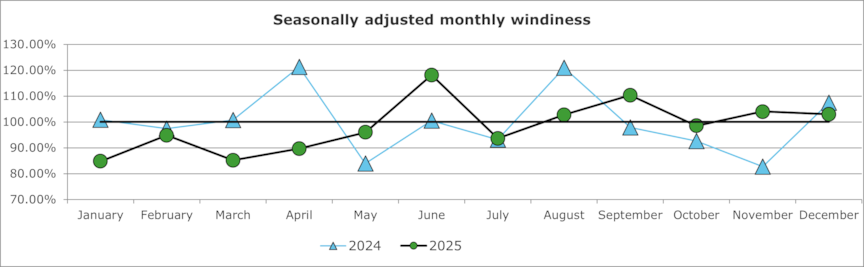
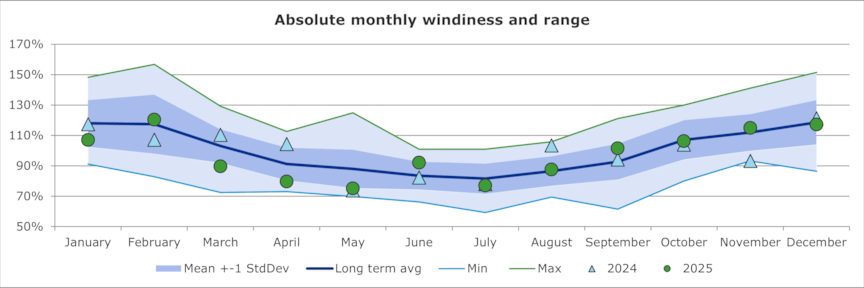
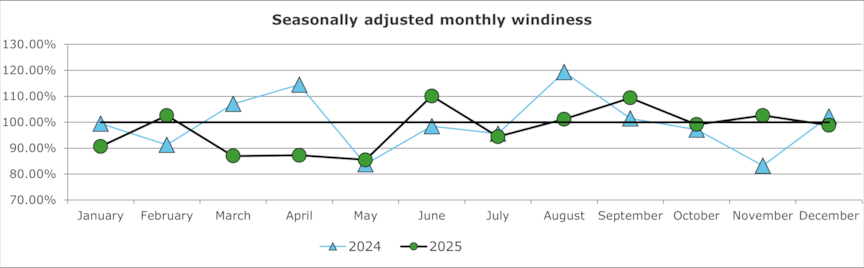
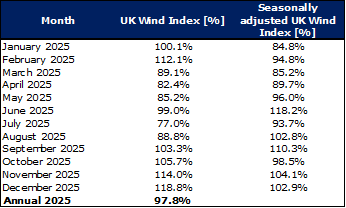
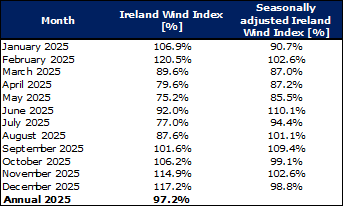
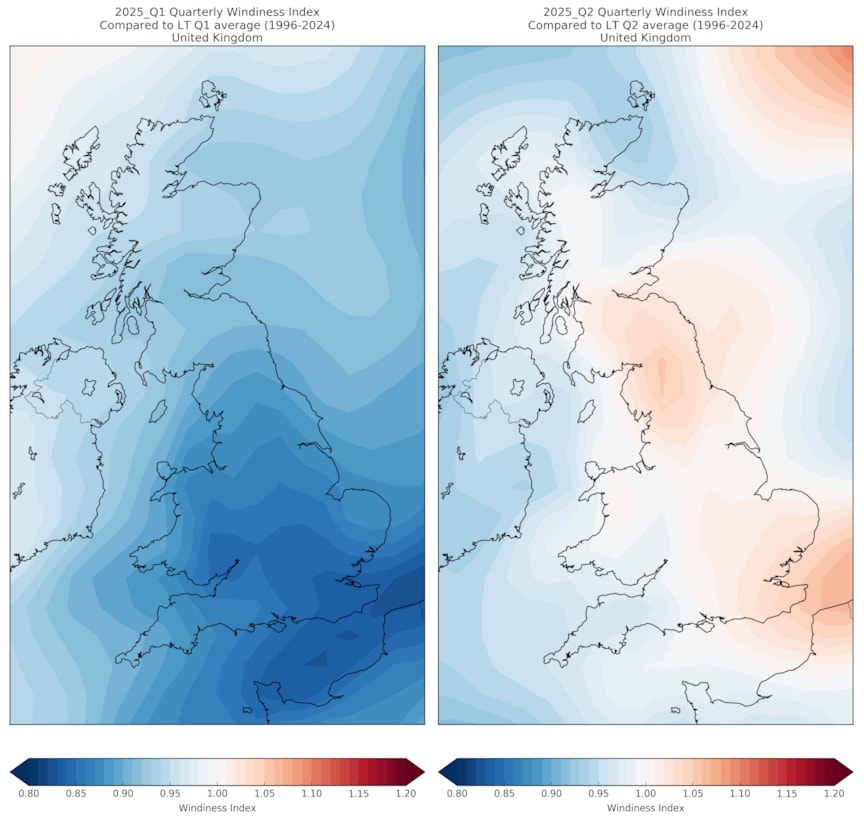
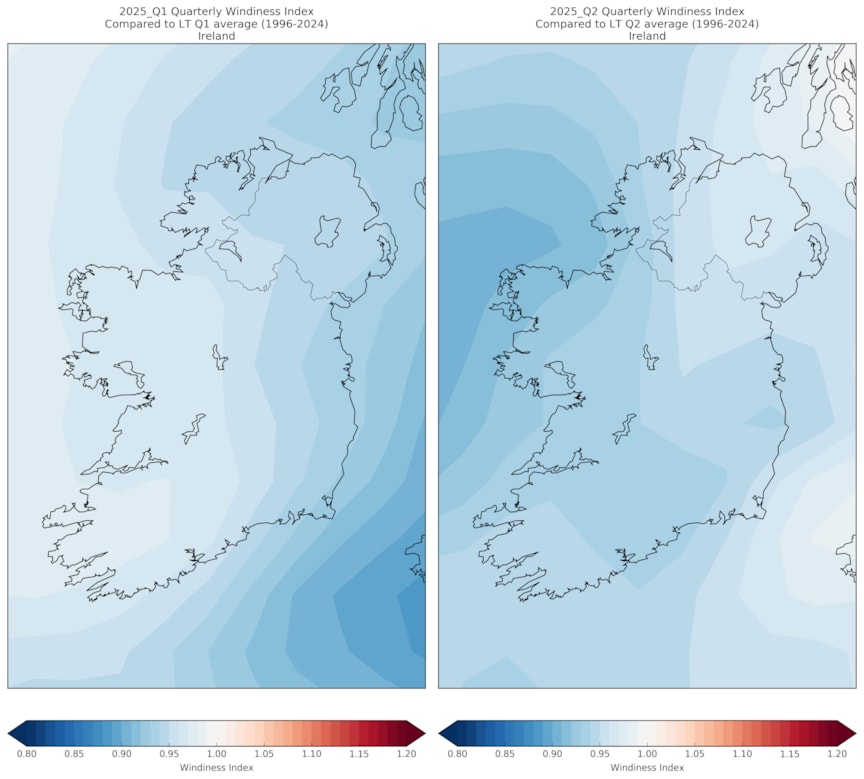
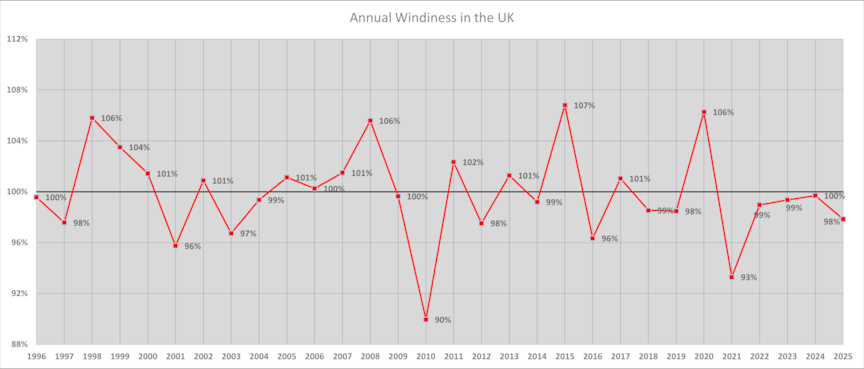
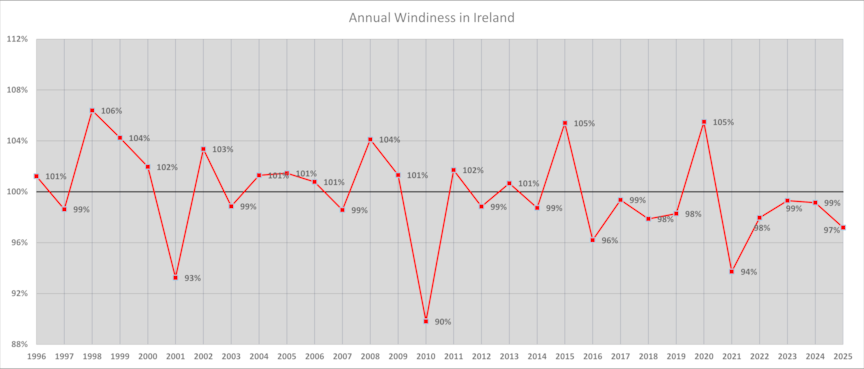
Across 2025 the windiness index followed a normal trend based on the seasonality of wind resource in the UK and Ireland. Most months would be considered normal and fall within the standard deviation of the long-term period. However, in the UK, January, March, April, and June fall outside of the standard deviation, with weaker than normal winds in January (-15.2%), March (-14.8%) and April (-10.3%) and stronger than normal in June (+18.2%). In Ireland, winds were outside of the standard deviation in March (-13.0%), April (-12.8%) and May (-14.5%).

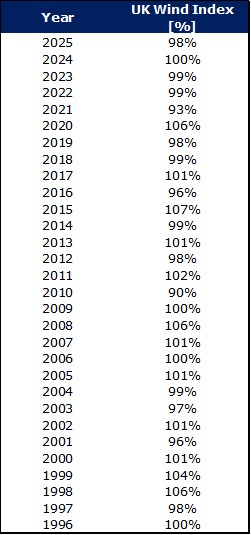
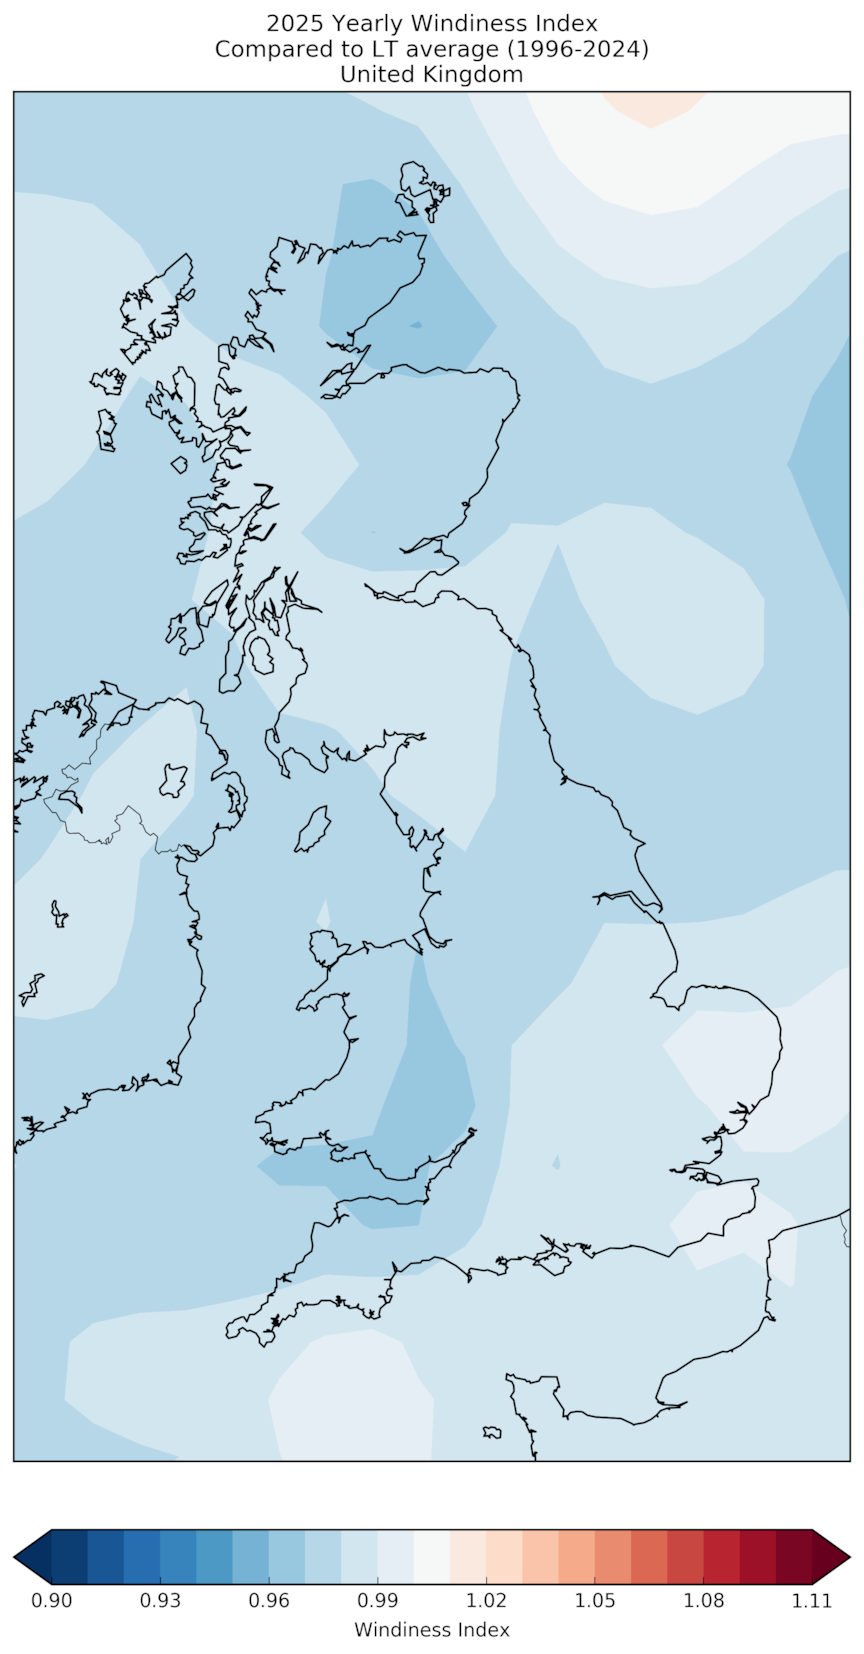
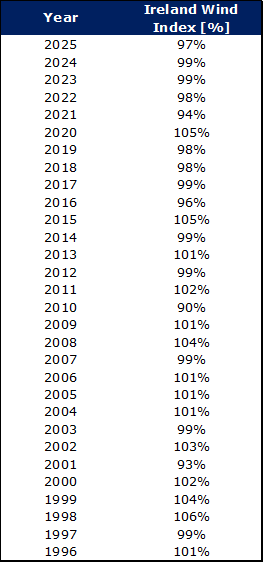
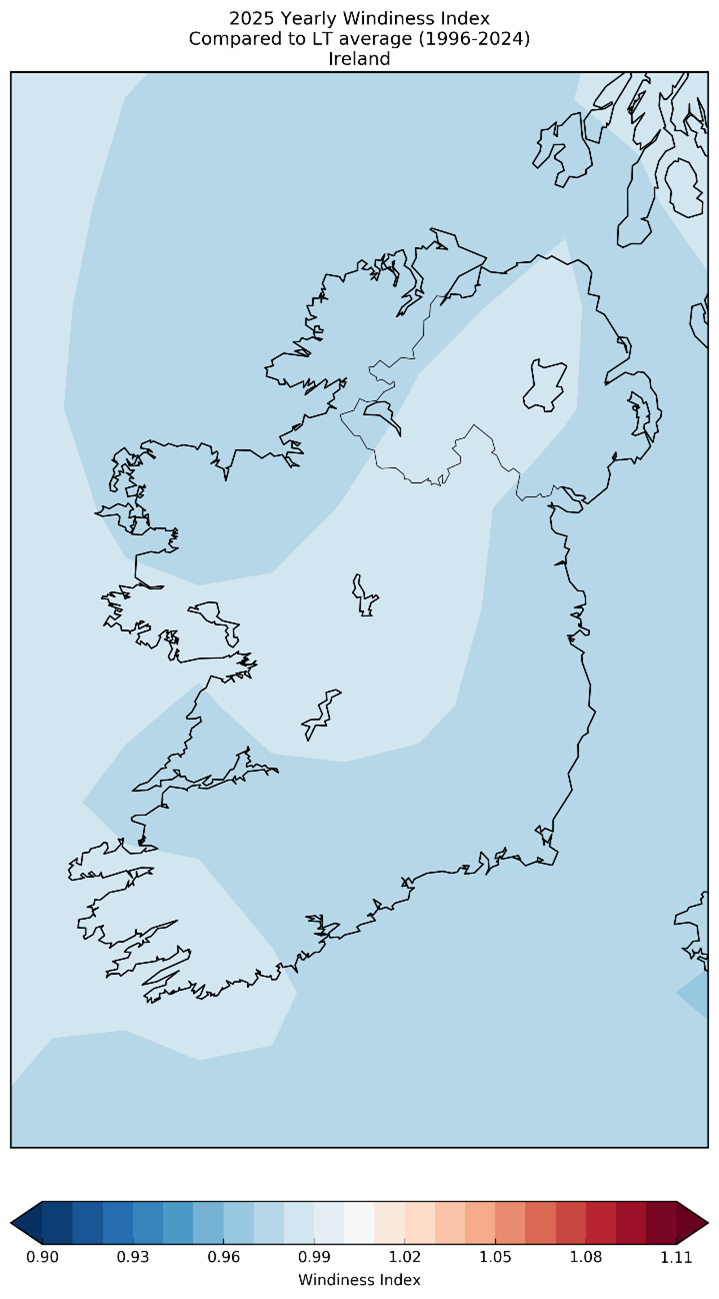
Overall, DNV’s Wind Index demonstrates that 2025 was less than 2.2% less windy on average for the UK (coming in at 97.8%) and Ireland was 2.8% less windy (coming in at 97.2%) than the 1996-2024 long-term reference. A full breakdown of the monthly and quarterly wind indices for 2025 is given in the tables below, along with the ‘windiness’ for each complete year in the index. For ease of referencing, the monthly index for 2024 is also shown.
 

Absolute monthly windiness and range UK

Seasonally adjusted monthly windiness UK

Monthly windiness for the UK

The year 2025 began with lower‑than‑average wind speeds across both the UK and Ireland, when viewed through the seasonally adjusted wind index. In the UK, Q1 (Jan–Feb–Mar) recorded an index of 88.1%, with all months sitting below the long‑term averages were January (84.8%), February (94.8%), and March (85.2%). Ireland showed a similar start of year pattern, with Q1 finishing at 93.2%. January (90.7%) and March (87.0%) were notably subdued, while February (102.6%) was the only month of the quarter to exceed the long‑term mean.

The subdued pattern continued into early Q2 for both regions. Unlike 2024 - when April stood out as an exceptionally windy month - April 2025 was again below average, with seasonally adjusted wind speed index of 89.7% in the UK and 87.2% in Ireland. May also remained calm, particularly in Ireland (85.5%). The most notable feature of Q2 was the change of wind conditions in June, which delivered the first clearly above average month of the year for both regions. Seasonally adjusted wind speeds reached 118.2% in the UK and 110.1% in Ireland, marking a distinct transition from the calm conditions of April and May. This June surge lifted the UK’s overall Q2 index to slightly above average (100.8%), while Ireland’s Q2 remained below average at 93.8%.

Wind speed indexes remained within one standard deviation during Q3. In the UK, July and August were near normal, while September stood out as a windy month, reaching 110.3%. Ireland followed a broadly similar pattern, with September (109.4%) also emerging as the windiest month of Q3. These late  summer recoveries brought the seasonally adjusted Q3 indices to 102.5% for the UK and 101.8% for Ireland, both marginally above the long  term.


Absolute monthly windiness and range

Seasonally adjusted monthly windiness

Monthly windiness for Ireland

Q4 showed consistent, steady conditions rather than strong anomalies. All months in the UK hovered around the long term average, giving a quarterly index of 101.9%. Ireland’s Q4 profile was similar, with October, November, and December all close to 100% after seasonal adjustment. This balanced autumn winter pattern helped moderate the weaker periods earlier in the year.

As a year, both the UK and Ireland experienced slightly below  average winds in 2025, with annual wind indices of 97.8% and 97.2% respectively. The year was shaped by a notably calm first quarter and a calmer than usual April – May period, followed by a gradual recovery as the year progressed. June provided the first meaningful return to stronger winds, and the remainder  of the year settled into a more typical pattern, with most months in the second half sitting close to seasonal norms. 

UK Wind Index 2025 Ireland Wind Index 2025
UK Wind Index 2025 - quarterly Ireland Wind Index 2025 - quarterly

Regional variations

It is also important to consider the spatial distribution of the wind regime across the countries during the last year. Looking at the windiness maps for the UK below, we can observe that the Q2 and Q4 spatial distribution were more uneven than Q1 and Q3. Q1 saw lighter-than-normal winds throughout the UK. In Q2, northern England and the south-east of England experienced slightly positive anomalies while Northern Ireland and Scotland saw slightly lower-than-average wind speeds. Positive trends were observed for the UK throughout Q3, while in Q4 almost all of England and Wales experienced positive trends and further north in the UK, in Scotland and Northern Ireland the wind trends tended to below average. 


2025 Q1 Q2 quarterly Windiness Index UK


2025 Q3 Q4 UK Windiness Index


Wind farms in all parts of Ireland had slightly lower wind speeds than usual in the first 6 months of the year. In Q3 positive wind speed trends were observed throughout the Ireland with the strongest trends observed along the Atlantic coast. Q4 trends were roughly in line with the long-term average. 

2025 Q1 Q2 Ireland Windiness Index


2025 Ireland Quarterly Windiness Index


Ireland Wind Index 1996 - 2025 2025 Ireland Wind Index - yearly

Long-term average and variability trends    

For clarity, long term graphs for both the UK and Ireland are shown to illustrate the fluctuation of windiness indices since 1996. This is an average taken across the region, to see this data for individual sites, speak with the DNV Forecaster team

Annual windiness in the UK

Annual windiness in Ireland

Interpreting the data to establish the impact 

Annual windiness remained lower than average in 2025, and was lower than the windiness observed in 2023 and 2024. What does this windiness index mean for wind farm owners, investors, and developers? All other things being equal, wind farm owners can expect to have seen slightly lower production at UK and Irish projects during 2025, compared to the long-term, because of the decreased windiness. Using typical project wind speed to energy sensitivity ratios, it is noted that a 2% drop in wind speed corresponds to a decrease of approximately 3 - 4% in terms of energy production. This should be taken into consideration during reviews of project performance. Investors will have seen similar energy productions in their wind projects when compared to 2022 in Ireland and in the UK lower energy productions than 2023 and 2024 are expected. 

Wind farm developers who have been conducting wind measurements during 2025 can also expect the average wind speed to be slightly lower than the long-term average. This trend should be taken into consideration when adjusting measurements to be representative of a long-term period.

The UK and Irish Wind Indices

DNV maintains a UK and Ireland Wind Index, which enables owners and investors to assess the performance of potential or operating projects. Likewise, the Wind Index is a robust tool for wind farm developers, empowering them to understand the ‘windiness’ of their wind monitoring campaigns compared to a long-term period. To find out more about weather indices for your assets and speak with one of our engineers, contact us

The long-term reference period represents all years between 1996 and the year prior to the analysis. The UK and Irish Wind Index is normalized so that the average wind speed over the long-term period is 100%. The windiness of any given period is expressed as a percentage of the long-term average wind speed. Thus, a value exceeding 100% indicates that a period was windier than the long-term average, whilst a value below 100% suggests that a period was less windy.

Seasonal effects

Wind speeds in the UK and Ireland exhibit strong seasonality, with a tendency for higher wind speeds during the winter months and lower wind speeds during the summer months. As a result, DNV also derives a seasonally adjusted Wind Index, which has been corrected for seasonal bias.

To be more precise, the windiness of any given period is expressed as a percentage of the long-term average wind speed for that specific period. For example, the long-term windiness of the month of January is 118%. If a specific (individual) January has an index value of 123%, the seasonally adjusted value for that January would be 123%/118% = 104% (+4%).

About DNV
DNV offers a new service for generating bespoke monthly Windiness Reports for your portfolio. This includes an average of your entire portfolio and a breakdown of each one of your assets. For more information, please contact Doireann Kavanagh. Learn more about our full range of services and products.