Capturing the volatility of future power prices

Potential investors and lenders in renewable energy projects are grappling with energy policy, market design, regulatory uncertainties, and electricity price volatility. This makes it tough to forecast future prices and hence revenues.
It does not need be so hard: as energy project stakeholders at a recent DNV-led seminar in Paris, France, heard, a more sophisticated modelling method deepens understanding of merchant risk to support decision-making in energy investments. The model employing machine learning is being used to better predict future capture prices for electricity.
Power price volatility rising in France
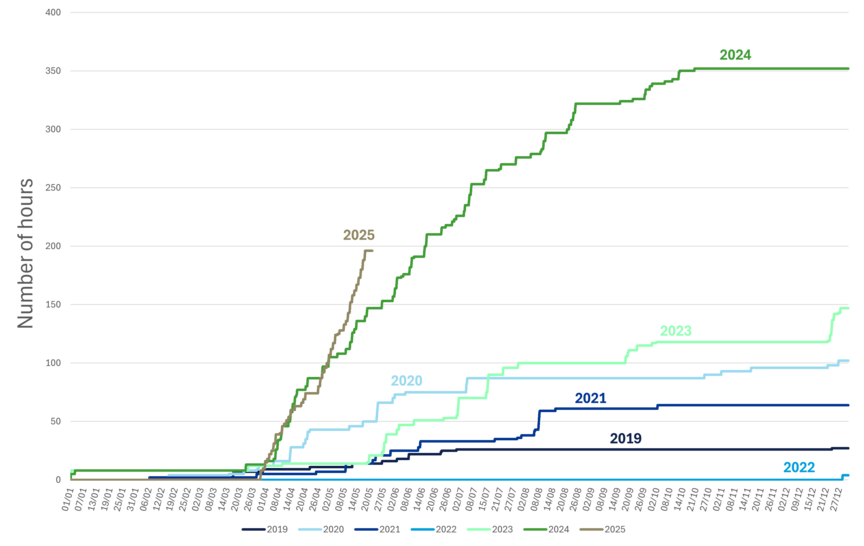
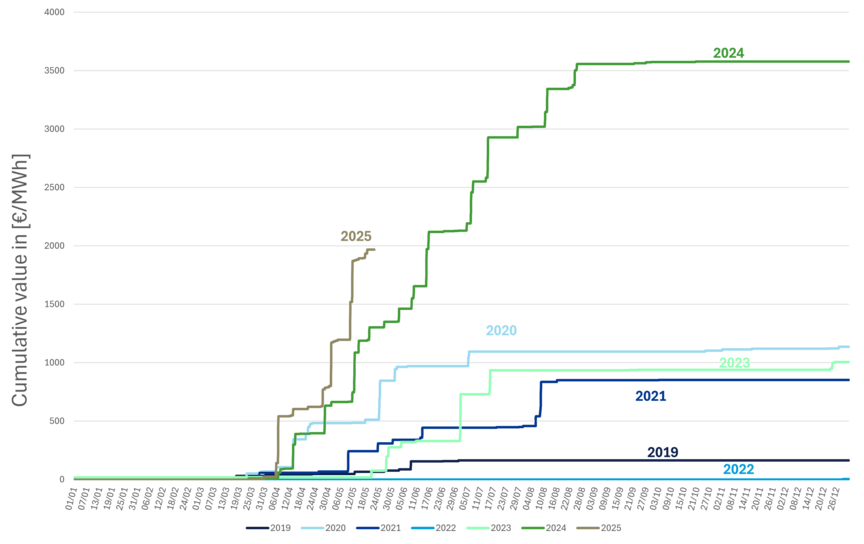
The seminar took place after a year, 2024, in which spot and forward electricity prices showed marked volatility in France and in a period where the number of negative price hours is setting new records every day.
DNV experts presented and led discussion on strategies to mitigate financial and operational risks in battery energy storage systems (BESS) within France’s evolving energy market and regulatory landscape.
Complexity is rising
Financing for new renewables projects can be derisked somewhat through various state support mechanisms and through power purchasing agreements (PPAs) with private offtakers. But lenders and investors need robust estimates of what the asset value and revenues will be when a PPA expires or fails.
Forecasting to support investment and lending decisions for assets that will start operating years from now is bedevilled by the simple fact that France’s electricity system, as in other countries, is necessarily becoming more complex in its energy transition.
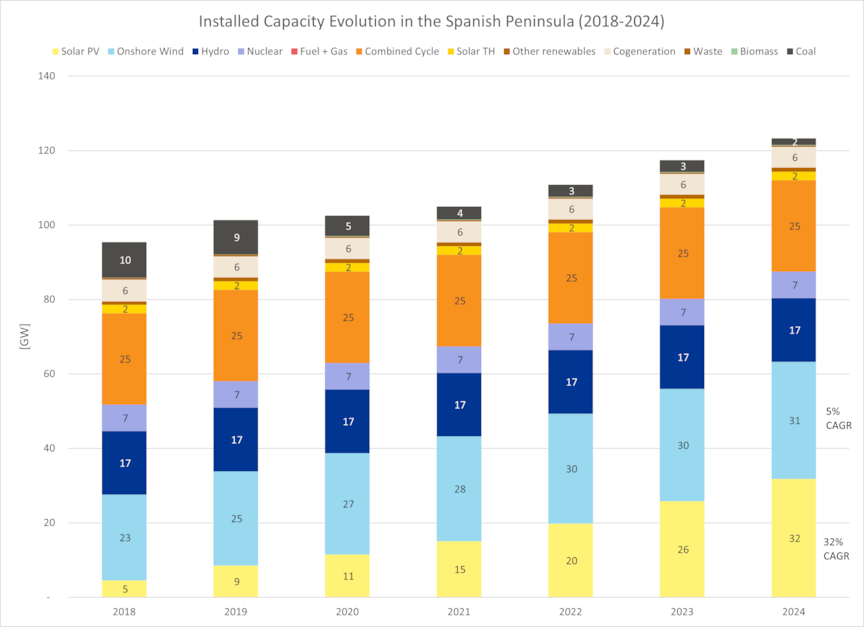
Of France’s 536.5 TWh electricity generation in 2024, two-thirds (67%) was from nuclear, 14% from hydropower, 8.8% from wind, and 4.3 from solar – in total, almost 28% was from renewables (data source:(TSO) RTE), and most of it was from low or zero marginal cost production.
The installed capacity of wind and solar are growing but are additional to nuclear generating capacity rather than replacing it.
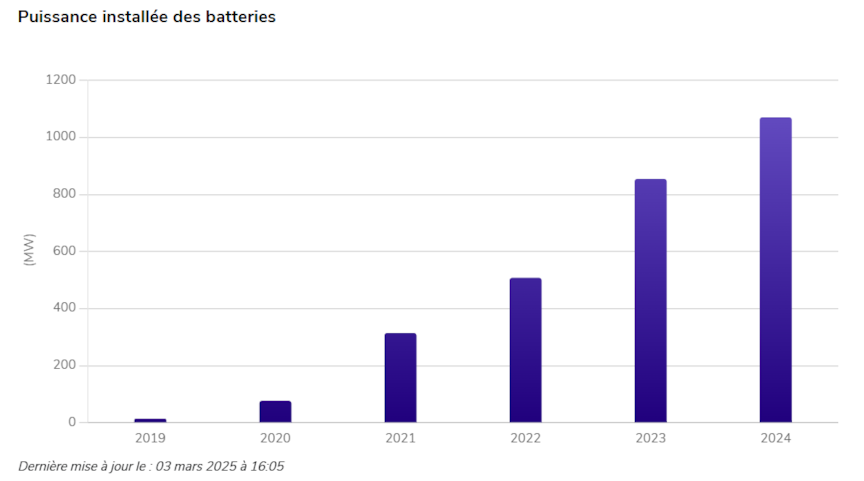
Battery energy storage capacity in the French system has grown steadily over five years to approaching GW 1.1 in 2024.
Consumption trends
These technology trends are developing in a France where energy consumption per capita fell 11% and energy intensity of the economy by 35% between 2000 and 2023. There is also uncertainty over the timeline for retiring ageing nuclear plants.
To add to growing complexity, France also has cross-border electricity interconnectors – whose capacities are to be strengthened – with countries undergoing a deep energy transition (Spain, Germany, Great Britain, etc.). For example, it can receive competitively priced electricity from Spain’s solar photovoltaic farms but also export power to the East that undergoes high prices in the evening. In 2024, France’s electricity exports were 101 TWh and imports 12 TWh.
Volatility is set to persist in the transition
On the one hand, and where market design and regulation allow, price volatility can present opportunities for investment in assets such as battery energy storage systems (BESS) to counter volatility and provide ancillary services that generate revenue from contributing to grid balancing. On the other hand, this volatility is often paired with periods of very low prices and high peak prices that are key for other kinds of business cases.
Volatility is not an abnormal phenomenon; it is a key feature of a mix with high zero marginal cost-asset penetration like the one we are envisaging in Europe, and that is why we expect it to continue.
Having reliable forecasts of this volatility is important for understanding the key phenomena at stake in tomorrow’s system. Chief among these is storage energy arbitrage, which requires a good modelling of price spreads. Other issues of importance are price cannibalization, the value of ‘peakers’, and so on.
Modelling future price uncertainty
Price volatility is a challenge for asset owners making fixed debt repayments to lenders while grappling with uncertain future revenues from the power market. Volatility will be influenced by the power mix evolution and should trigger investments in flexibilities of all sorts, most of which need good merchant-based revenue forecasts.
However, modelling price volatility with classical tools is not straightforward. Certainly, modelling can be performed on the basis of fundamentals that are the norm today. But this entails exponential complexity of the model with only limited marginal improvements.
Recognizing this barrier, DNV’s Power Analytics service offers a different but robust approach based on longstanding and global experience supporting stakeholders across entire value chains in electricity generation, transmission, distribution and markets.
Applying machine learning to handle complexity
The approach solves the complexity issue by taking the fundamental model then layering on top of it a model based on machine learning, a subfield of artificial intelligence. Machine learning lets DNV capture effects that would otherwise be almost impossible to capture with a classical model and that would require extreme levels of complexity.
Using this multi-layered approach, we can calculate the expected prices from which revenues and opportunities for each asset of interest can be deduced, and for:
- A base case: The most probable case based on DNV experts’ expectations
- A slow transition case: A realistic case where the energy transition is much slower than base case, to sensitize the expected revenues
- A fast transition case: A realistic case where the energy transition is rapidly reshaping the energy mix.
In the French context, for example, modelling for the three cases is essential when considering the future participation of nuclear in electricity supply. Nuclear has a very important impact on prices and price volatility.
Benefits of enhanced modelling and insights
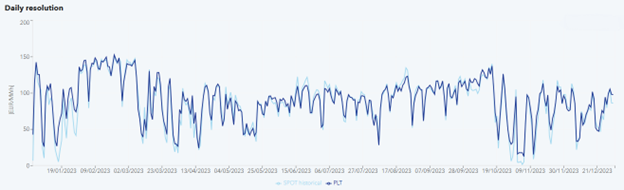
DNV’s modelling approach derives a very good hourly shape for prices, and with very good matching on back testing. Machine learning also enables our modellers to be more agile with a leaner fundamental model, a useful benefit when it comes to testing scenarios and changing parameters for specific clients’ needs.
To improve accessibility and usability of the model’s output, Power Analytics is available to clients through a trusted, secure web-based platform called Veracity. It offers continuous access to updated long-term price projection reports and market-leading information on various attractive energy destinations worldwide, including France.
Summing up
Summing up, the increasing complexity of electricity systems need not be an obstacle to robust forecasting of long-term price volatility as a strategic tool for decision-making, guiding investment and hedging strategies.
The sophisticated model used by experts in DNV’s Power Analytics team cuts through complexity by using machine learning to calculate base, high, and low expected revenues and opportunities for each asset of interest.