High-pressure systems in Europe and clearing pollution in China boost solar production

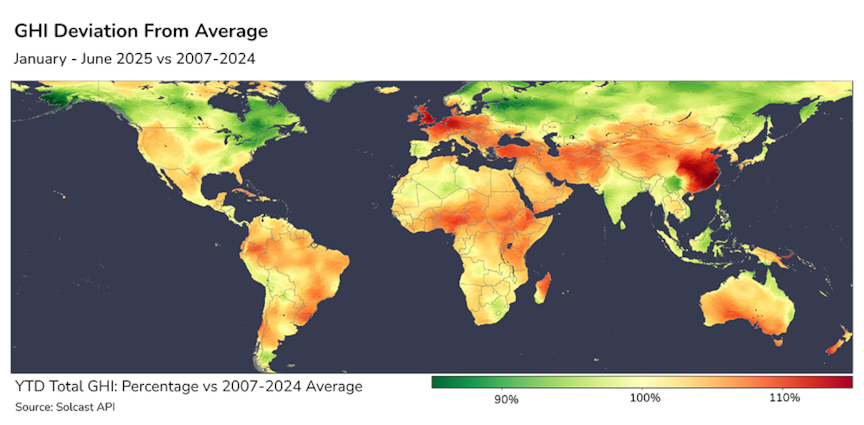
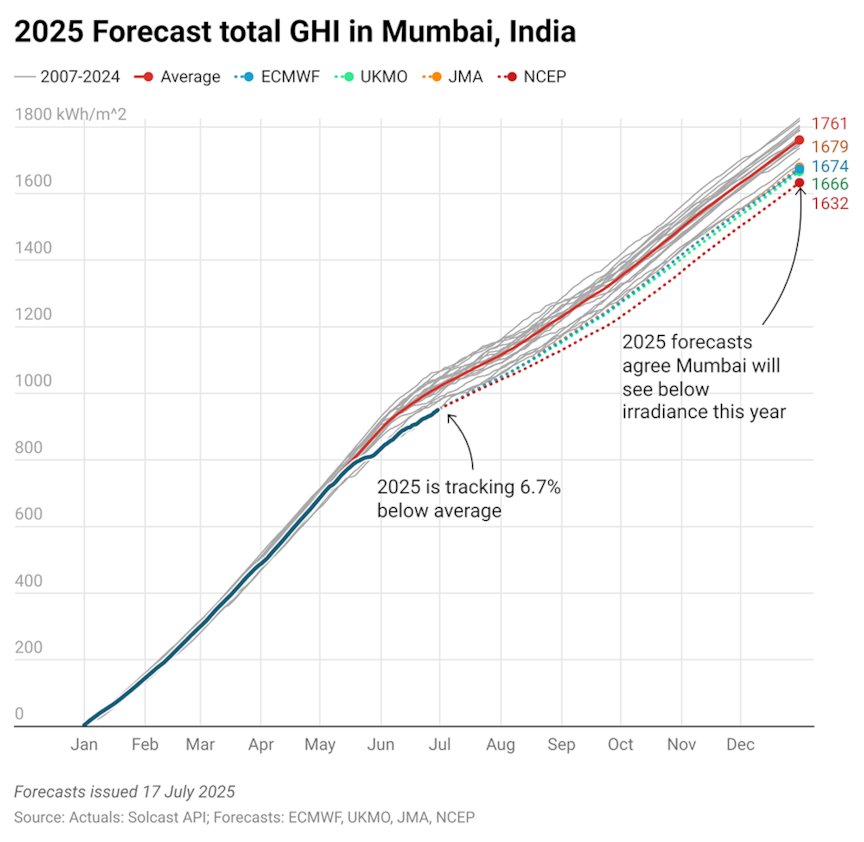
The first half of 2025 has delivered favourable solar conditions across several key solar generation regions around the globe, with many population centres experiencing above-average irradiance. Notable exceptions include India, Southeast Asia, and high northern latitudes, where cloudier conditions prevailed. These patterns have been influenced by persistent high-pressure systems and a weak to neutral La Niña phase.
European Solar benefits from ideal conditions
In Europe, a dominant high-pressure blocking pattern over central and western regions led to irradiance levels 5–15% above historical averages.
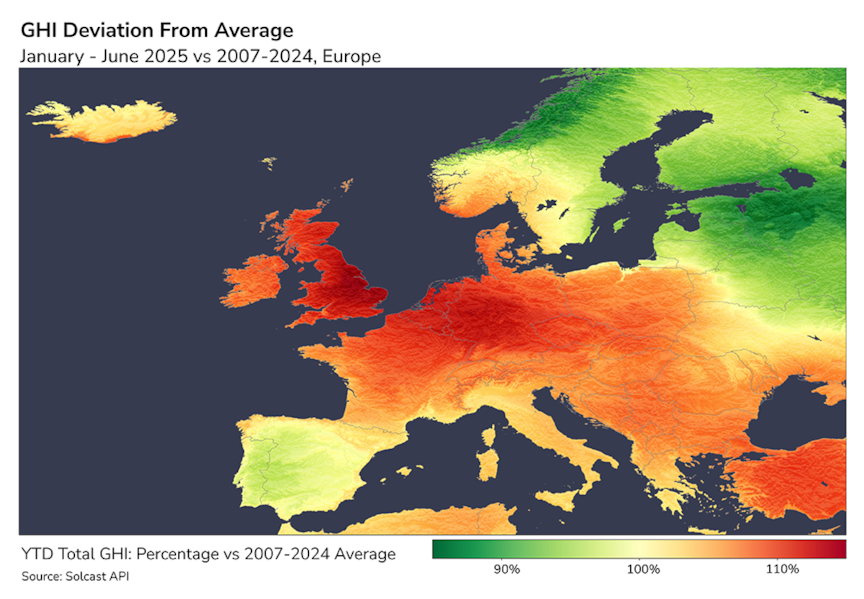
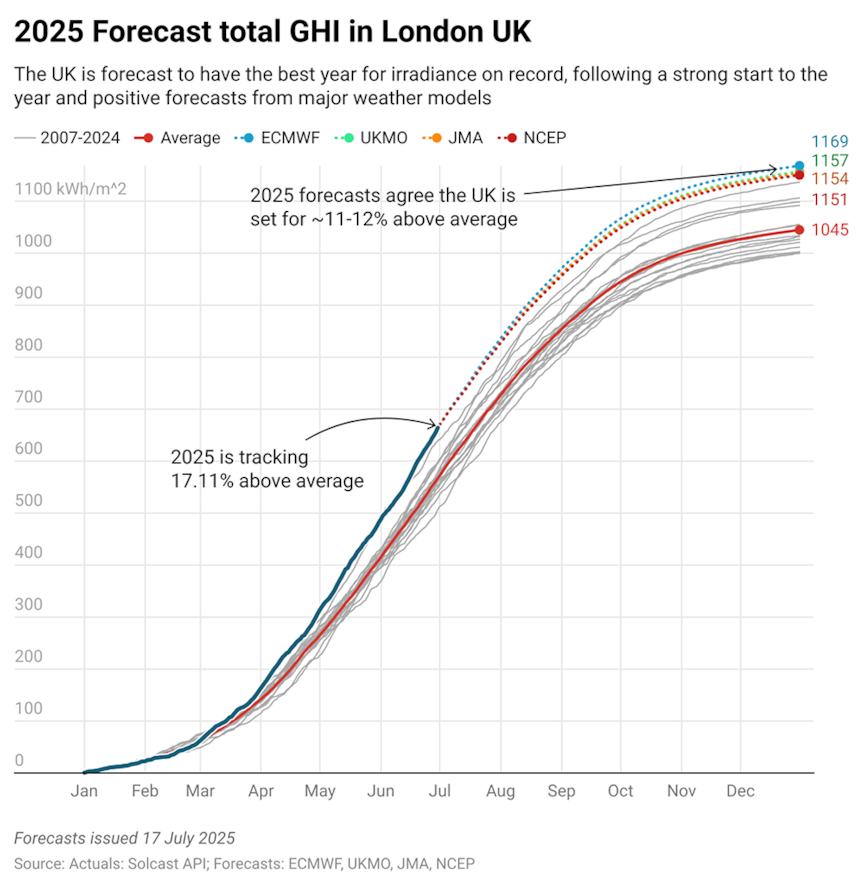
The United Kingdom stood out with irradiance approximately 15% above norms, marking its sunniest start to the year on record. This surge occurred despite a mid-February period of exceptionally low irradiance. Positive solar anomalies were seen from Scotland to Turkey, with this wide band recording 8-15% above long-term trends. This positive anomaly will have gone some way to supporting power supply during a wind drought – where the same regions suffered from reduced wind power. Seasonal forecasts for the rest of the year, whilst still subject change, suggest that much of Europe, including the UK, will end the year ~10% above average for total annual GHI.
Conversely, the Nordics and Baltics experienced significant declines in solar availability, and the Iberian Peninsula saw conditions at or below average, with increased cloud cover and precipitation.
Western US sees slight benefit, but Northeast Solar limited by Atlantic storms and smoke effects
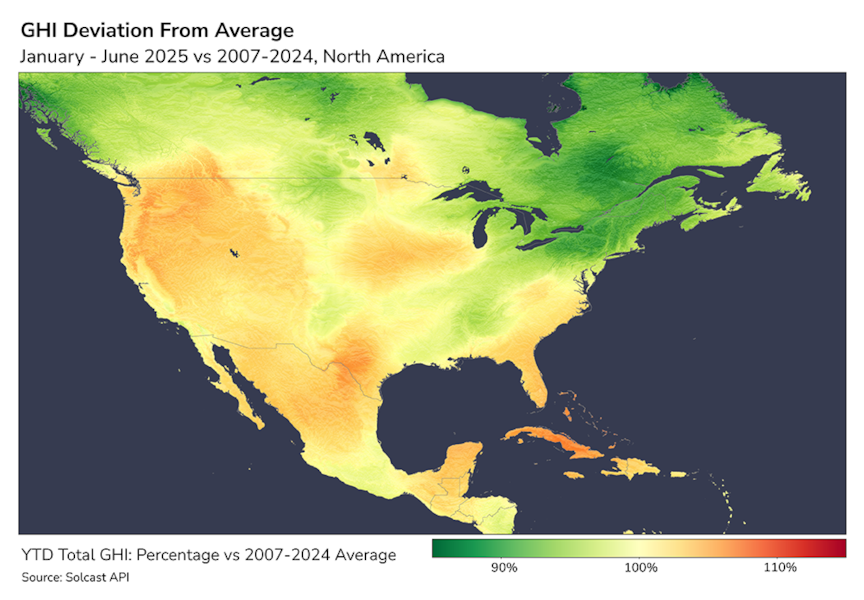
North America's solar performance was mixed. The western United States, particularly areas west of the Rockies, benefited from a series of high-pressure systems, resulting in about 5% more irradiance than typical coming from a strong start in January and despite a weak February and March. Mexico experienced similar gains.
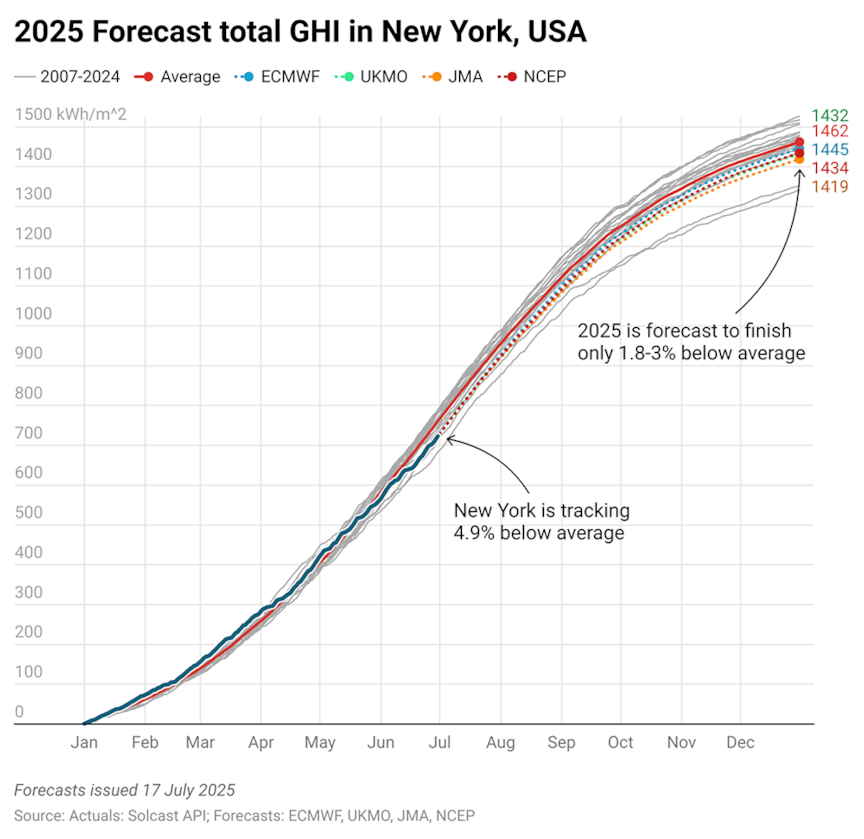
However, the Midwest, South, and Northeast faced generally cloudier conditions, with exceptions in parts of Texas and Florida, in part due to a sunny March. Canada, influenced by La Niña-driven storm tracks, and with some impact from aerosols due to wildfires, saw irradiance nearly 10% below average in the first two quarters. Seasonal forecasts suggest that without wildfire impacts, the Northeastern US is likely to end the year close to average.
China benefits from decreased aerosols, setting solar records
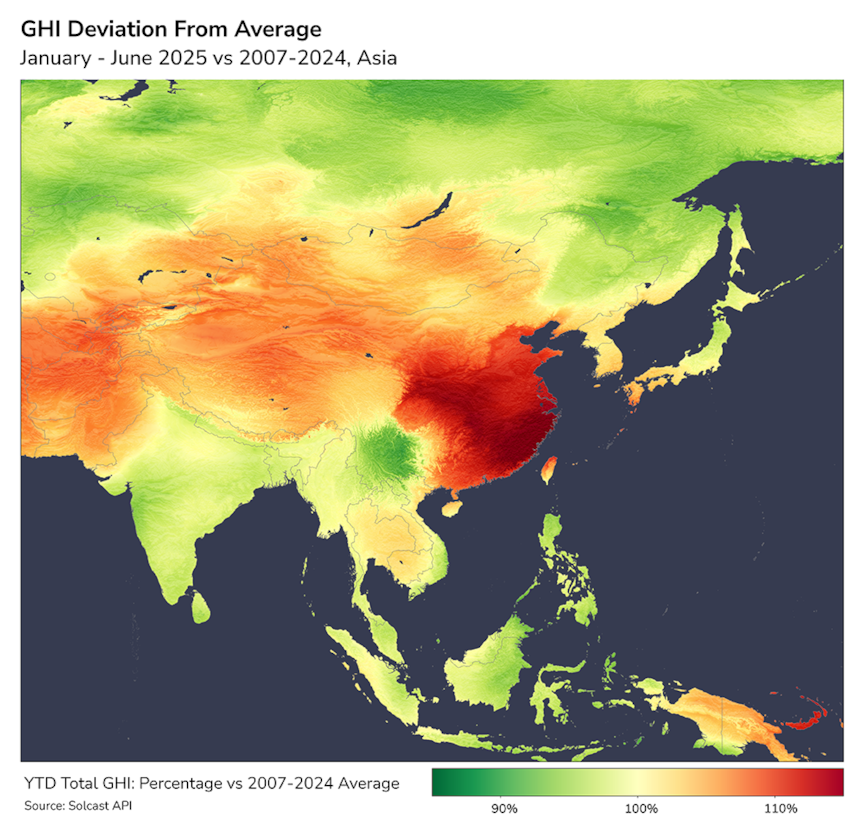
China saw a material positive anomaly, especially in its eastern regions, which experienced the strongest start to the year globally. January irradiance was up to 60% above normal, tapering to 30% above by April.
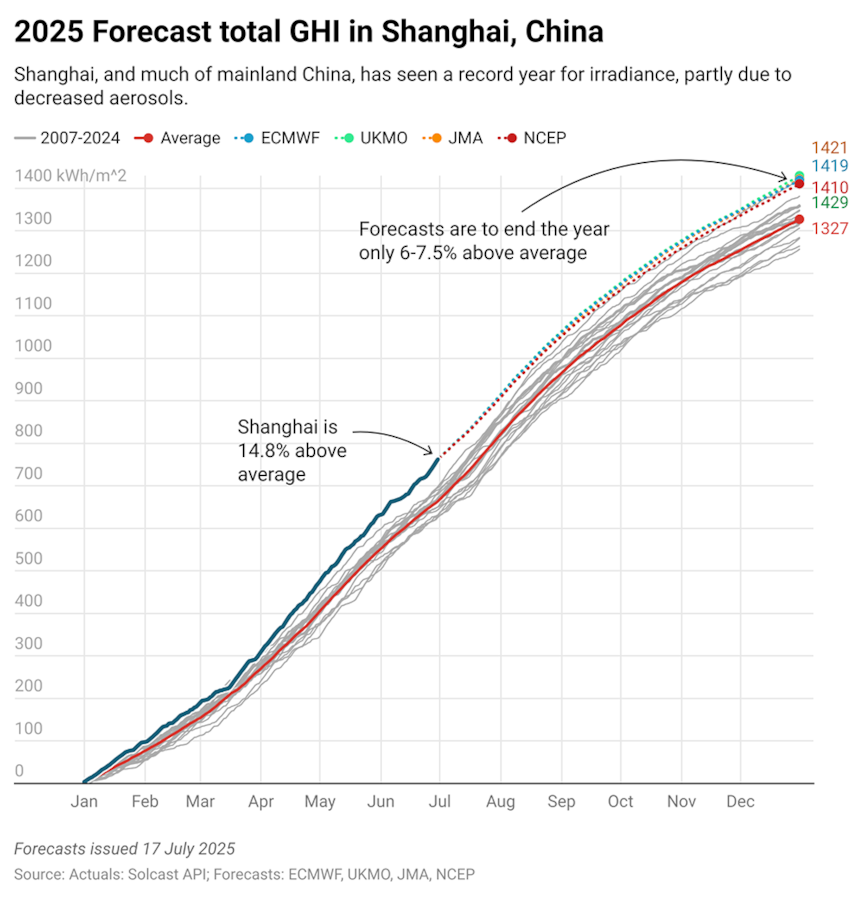
This was attributed to a mild La Niña onset, subdued trade winds, and reduced aerosol concentrations. In contrast, other parts of Asia, including India and Southeast Asia, contended with cloudier-than-normal conditions.
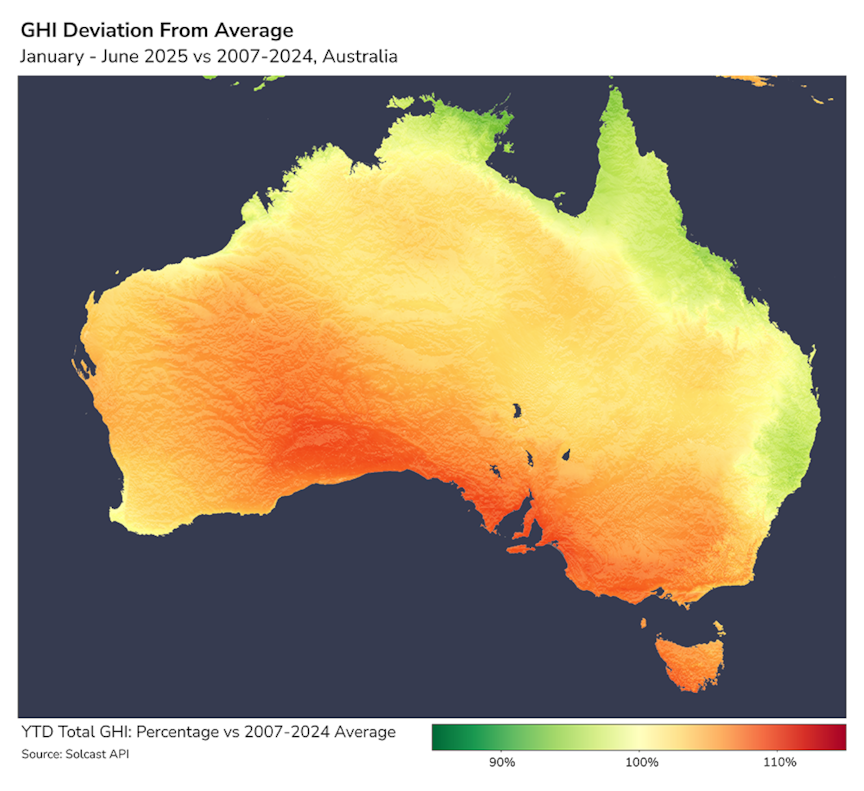
South America and Australia largely mirrored global trends, with higher-than-usual irradiance in the year's first half. These patterns occurred despite the year commencing under weak La Niña conditions, which is associated with wetter weather for Australia and northern South America.
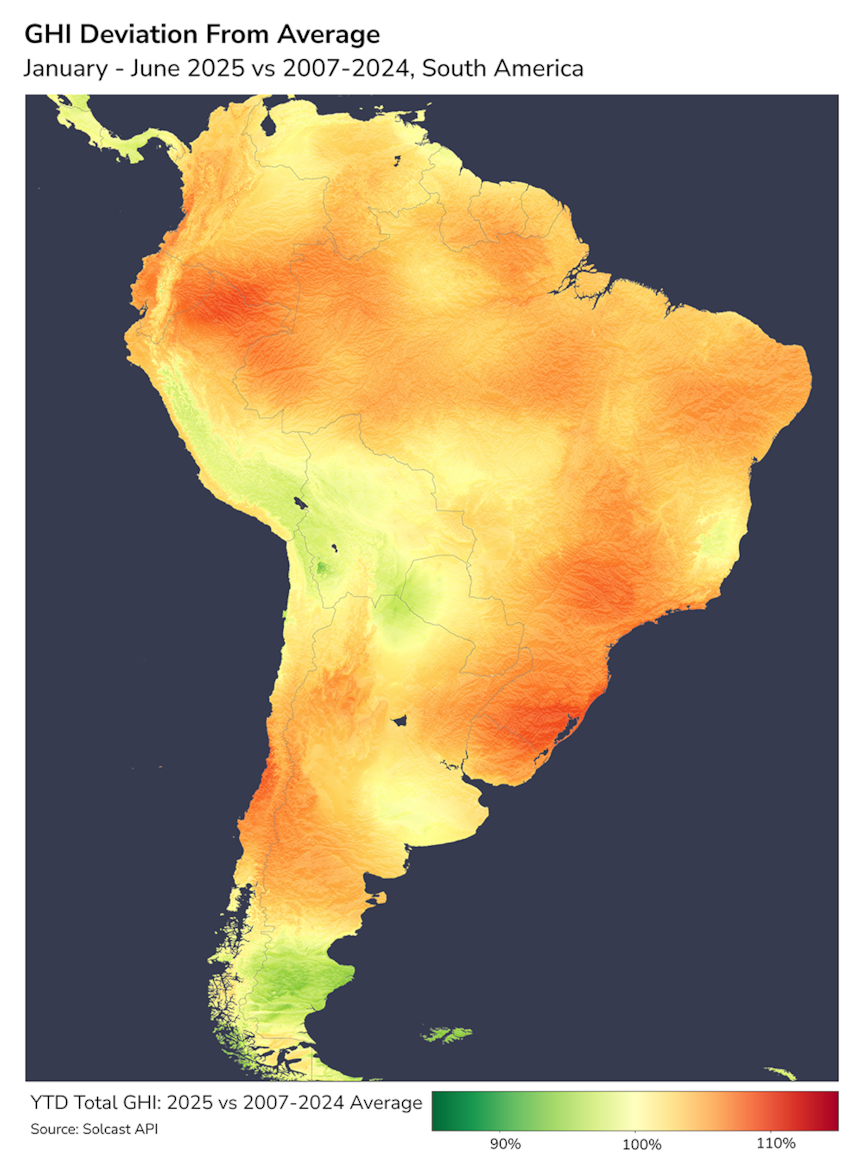
Exceptions were noted in parts of Chile, Bolivia, and Argentina, as well as in Australia's northern and eastern coastal fringes where persistent moisture from the Coral Sea played a role.
Regional climate patterns and atmospheric conditions influence solar conditions
The first half of 2025 delivered exceptional solar conditions in many major markets, with record-breaking irradiance in the UK, sustained gains across central and western Europe, and remarkable boosts in eastern China driven by clearer skies and reduced pollution. At the same time, cloudier-than-average conditions in India, Southeast Asia, the Iberian Peninsula, and parts of North America tempered generation potential.
Such variability underscores how regional climate patterns, high-pressure systems, and atmospheric changes can dramatically shift solar output from one year to the next. As global solar capacity, including behind-the-meter rooftop solar, increases, grid dynamics are changing.
For asset owners, managers, and system operators, understanding these weather-driven effects is essential to accurately measuring long-term performance and making informed operational and investment decisions. DNV’s global datasets and advisory services enable stakeholders to distinguish climate anomalies from operational factors, delivering weather-adjusted performance insights for solar and wind portfolios worldwide.
Learn how DNV can help decipher weather-adjusted asset performance
DNV's green data products, including Solcast, a DNV company, are delivering trusted data, models, and platforms for the global renewable energy industry, modelling energy and power for solar and wind portfolios, and markets all over the world. The Solcast API processes global live and forecast weather data every five minutes, powering financing, construction, management, and operation of over 650 GW of solar capacity worldwide. Speak with our Head of Data Science, Hugh Cutcher, or Head of Commercial, Ben King to understand how DNV's suite of bankable, digital green data products can help you to manage and model your renewable energy assets.