


5
%
annual revenue
goes to strategic research, innovation & technology development
50
+
years
developing software to support our customers
86
%
score
for customer relationship strength
Search for a Digital Solutions service, or click the link to explore.
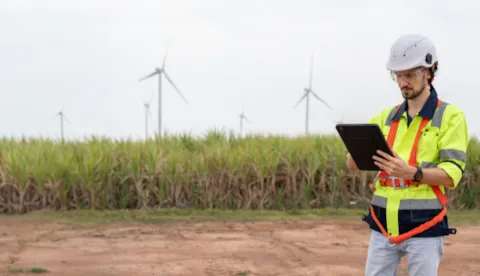
In focus: The Energy Transition
Our 'Decoding the Energy Transition' video series simplifies the complexities of the energy transition, answers critical questions, and provides practical insights into the big challenges.
Watch our energy transition video series
Explore the full series here and let our decoders give you the confidence to navigate the energy transition effectively.
Download the Energy Transition Outlook 2025
Explore our flagship report: A global and regional forecast of the energy mix, supply, and demand to 2060


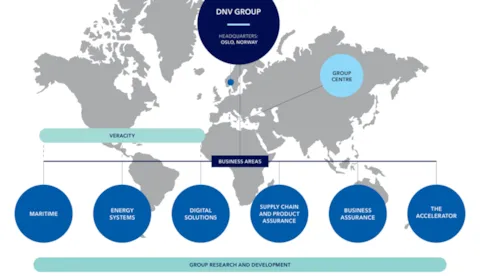
Digital solutions
Creating secure and trustworthy digital solutions

Digital solutions
Explore the Offshore Wind Explained video series

Digitalization in the energy industry:
The views of the C-suite
The world's energy systems are transforming rapidly. Digital technologies are driving and underpinning much of this transformation, but is the industry keeping up with the pace of technological change?

Decarbonization
Decarbonize safely, reliably, and with confidence
Explore how our software solutions can help energy operators who are adopting the production, processing or transportation of low and zero-carbon products.
Publications
White papers, published papers and brochures
Training courses
Explore our software training overview
Support
Technical support, software downloads, access to FAQ, and knowledge sharing