Energy Storage Capacity Warranties: Beyond the Fine Print

Ten years or 100,000 miles. This short phrase may describe the terms of the warranty on your car. Despite the fine print, the message is clear: if any of the major components of your car break before you hit ten years from its purchase or drive it 100,000 miles, it will be fixed free of charge. It does not matter if you accelerate fast and brake hard, run your gas tank to empty, and never change your oil!
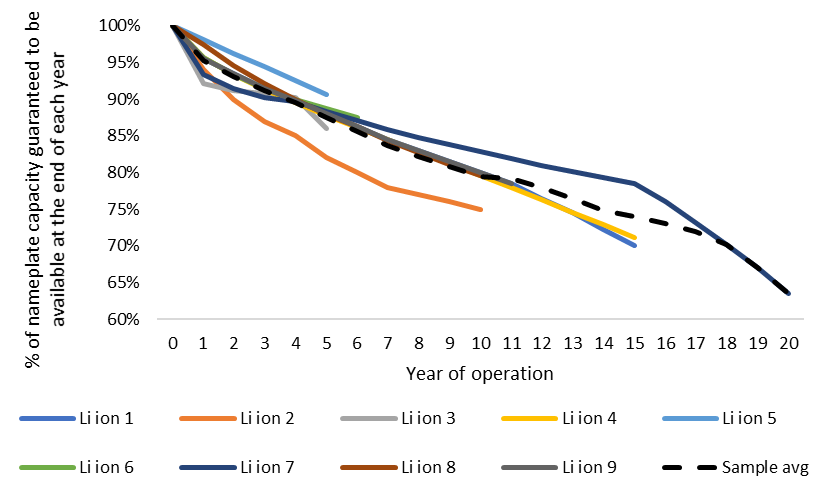
Operational requirements are common in energy storage warranties. Even with significant improvements in cell and system technology alongside cost reductions, warranty terms have become more complex. Car manufacturers are able to offer simple warranty terms because they understand the risk of component failure based on billions of hours of operational history with millions of different drivers. Storage manufacturers, on the other hand, leverage lab test results1 to inform their warranty terms knowing that differences in cycling, rest time, state of charge (SOC), temperature and other metrics all impact the performance and degradation of battery cells. There is no industry standard yet and these degradation curves vary widely across various lithium ion battery cell types (see Figure 1 below).
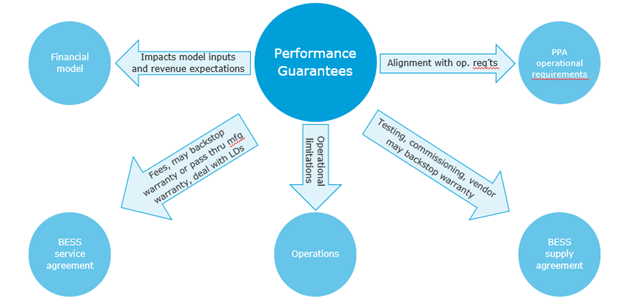
At DNV we recognize that warranties are a last resort we hope our clients can avoid enforcing as it takes time and money to file a warranty claim and can result in legal battles. The goal is always to focus on identifying ways a product can meet or exceed the performance expectations backstopped by warranties or guarantees. Nevertheless, warranties remain critical to the bankability review for a product or project. For storage projects, they form the foundation upon which all other supply, commissioning, operational, service, and financial documents are built (see Figure 2 below)3.
When we review capacity warranties we take a close look not only at the annual degradation curve provided, but at how it is measured, how performance is calculated, and any other operational restrictions imposed upon the project for the warranty to remain valid. Typical terms are shown in the table below, which is by no means comprehensive.
Table 1: Typical warranty operational restrictions
| Term | Typical metrics | Why DNV cares | Common mitigants |
| Capacity – usage/cycling degradation | % of year 0 capacity in a table/schedule for each year of the warranty term, often based on utilization in terms of cycles or throughput (discharged MWh), for example: 1 full discharge per day, on average | PPA contract may require minimum capacity or the revenue in the financial model may necessitate a level of capacity. Revenue or PPA operational requirements may not take into account warranty limitations | Dispatch modelling of the project use case with warranty limitations included as constraints or assumptions; capacity augmentation or battery replacement strategy included in service agreement or financial model |
| Capacity – calendar degradation | % of year 0 capacity in a table/schedule for each year of the warranty term, typically annual or monthly regardless of utilization | If BESS is underutilized, energy capacity still degrades. Sometimes actual warrantied degradation is the lesser of the two if both are included or calendar degradation can be baked into a single degradation curve | Align financial model and service terms with calendar degradation timeframe or include augmentation or replacement strategy for energy capacity expected to degrade |
| Term of warranty | 10, 15, or 20 years | Battery cell capacity does not degrade linearly; at some point they reach an end of life condition at which point they are no longer able to meaningfully hold a charge | If project life exceeds warranty term, include augmentation or replacement strategy for energy capacity expected to degrade |
| Temperatures | Maintain ~25 °C inside the container across all cells taking into account the range of expected outdoor temperature conditions | High cell temperatures can accelerate degradation.4 It is critical to understand where temperature is being measured (e.g., in container, in racks, at each cell), how often (e.g., yearly avg, daily, hourly, minute), what triggers an exceedance (e.g., one reading at highest cell, an average over a timeframe, etc.) | Service provider to take on responsibility for ensuring that temperatures in the containers or racks are maintained within a desirable range under all operating conditions as long as auxiliary power is present5 including service on the thermal management system |
| Average state of charge (SOC) | Less than 50% annual average SOC6 | Average SOC can impact the operational strategy because it may require sub-optimal (from a revenue perspective) discharge to maintain, especially in standalone (non-PV charged) BESS projects | Ensure operational strategy will not end up exceeding this limitation through modelling use case and imposing strict constraints in operations to ensure this metric is not exceeded |
| C-rate | 0.25 C, 0.5 C, or 1 C (i.e., 4 hr, 2 hr, or 1 hr battery discharge rate) | Exceeding allowable c-rates can void warranties or accelerate degradation | Use case of BESS should not exceed allowable c-rate in dispatch modelling |
| Data storage | Typically, second by second BMS data is recorded and storage for a few months then aggregated into minute or hourly data for longer term storage | This data is what is used in a warranty or safety dispute. The process is rarely specified in the warranty document, but it should be stored by the owner or a neutral third party to ensure it is available and agreed upon by all parties as a source of truth | Near-real-time data access to owner and BESS operator7 and regular planned data download to a secure offsite data storage location for project life |
| Response and repair time | Could be 24 hours or a few days for response; a month or so for repairs | Warranties are great, but the longer it takes a repair crew to remedy a warranty claim, the more revenue may be lost by the project owner | Ensure that repair time would not place unreasonable risk to project financials and include liquidated damages for any exceedances in response or repair time. Spare part inventory onsite should have common components |
Flexibility in the future
Imagine if your auto dealer told you that your car would be warrantied for twelve years or 120,000 miles if you averaged 55 miles per hour, got your oil changed every 5,000 miles, and never slammed the brakes, but your warranty would be reduced to eight years, 80,000 miles if you failed to properly maintain the vehicle. Would you drive differently?
As battery costs and performance continue to improve, developers will push the limits of use cases and risk, including increasing merchant market exposure.8 While some warranties are becoming more restrictive to enable longer warranty terms (e.g., 20 to 25 years), some BESS providers are offering more flexible warranty terms that put control and economic tradeoffs in the hands of the project owner or operator. These flexible warranty terms typically include formulas instead of a fixed table of values that use operational metrics as inputs (see Table 1 above) and then provide adjusted warranty curves for a given timeframe as outputs (see Figure 3 below).
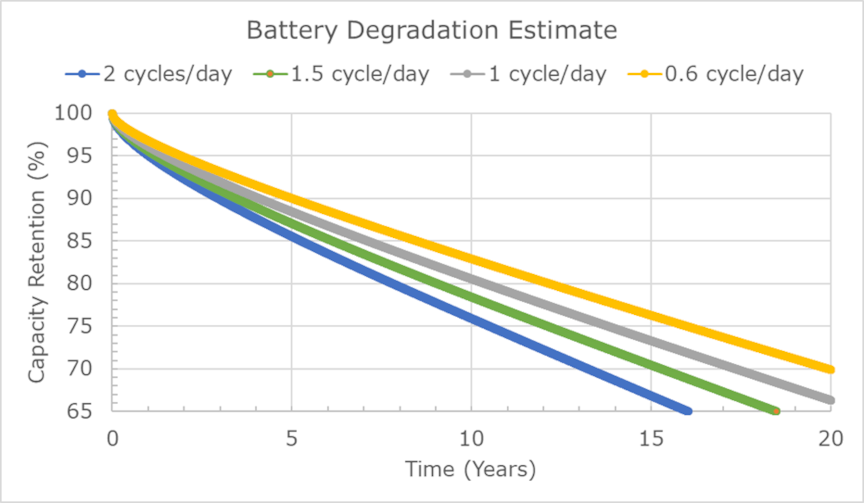
In this way, the owner or operator can decide, within a range a allowable operational strategies, how to operate the BESS to maximize revenue. For example, an operational strategy may be designed to maximize revenue based on historical average energy price volatility assuming 1 cycle per day. But an extreme weather event occurs (e.g., 2021 Texas freeze) that provides near term revenue opportunities but requires BESS operations of 1.5 cycles per day. The BESS operator may decide to more aggressively utilize the battery during the extreme conditions knowing that this might accelerate degradation and shorten the useful life.9 This decision may be perfectly acceptable to the owner depending on future price forecast expectations and assumptions about the time value of money.
The increased transparency of flexible warranties provides direct insight into the impact of BESS utilization on performance. DNV expects this type of flexibility (and complexity) to increase as the market matures requiring customized modeling that takes market and performance tradeoffs into account to identify the best strategy to meet project goals.
DNV’s experience with battery cell testing at its BEST Test Center, annual Battery Performance Scorecard, BatteryAI health monitoring platform, and industry experience allow for the most comprehensive data-driven support team in the market, no matter how you drive your BESS.
Footnotes
1DNV has a battery cell testing laboratory used to validate warranty terms, more info here: www.dnv.com/storagetesting.
2Curves based on warranties from various LFP and NMC lithium ion battery systems, aggregated and anonymized.
3BESS: battery energy storage system; the capacity warranty is one of several performance guarantees that may be in place for a product or project.
4www.dnv.com/2020BatteryScorecard.
5Auxiliary power is often a separate grid connection for thermal management systems like air conditioning.
6SOC is the percent of maximum charge of the BESS at any point. For example, a 100 MWh BESS at 50% SOC has 50 MWh. The average SOC is this metric measured over the course of time. Battery cells have different optimal average SOCs often reflected in warranties.
7DNV offers a near-real-time dashboard to monitor battery health against warranties called Battery.ai, express interest at https://store.veracity.com/5d729b9c-2cba-41fe-98bb-02a9a0f981ca-battery-ai.
8https://blogs.dnvgl.com/energy/unravelling-the-complexity-of-merchant-energy-storage-projects-part-i.
9When Tesla made over-the-air updates in 2017 that extended battery capacity of all Model S and X electric vehicles to help evacuees during Hurricane Irma in Florida, it is unlikely any of those drivers cared that they may have shortened the useful life of their EV by a few percentage points.
4/27/2021 1:00:00 PM