Europe faces wind drought whilst Northern US benefits from polar jet stream movements

The first half of 2025 brought challenging conditions for major wind power centres around the globe as some regions saw reduced wind speed, in particular in most of Europe, whilst some areas, namely Norway, the Northeastern US and areas in Northern China benefited from increased wind. As the share of energy from renewables increases globally, and as energy markets adjust accordingly, weather anomalies, increased sunniness and windiness compared to average or climatological conditions, have an increasingly large impact on energy prices and financial outcomes for asset owners and operators.
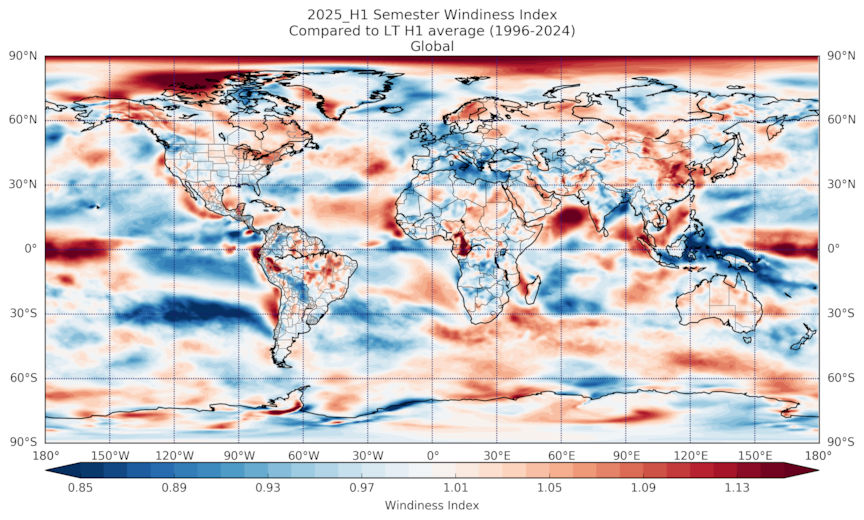
Analysis by DNV data scientists, comparing the first half of 2025 to long-term averages shows enhanced wind power potential in major wind power regions in Northern Europe and northeastern North America, while a wind drought hit large-scale deficits in windiness significantly limited wind generation opportunities across southern Europe, the central North Sea, Indonesia, and the Great Plains. These anomalies reflect the influence of hemispheric pressure patterns, including the positive phase of the North Atlantic Oscillation (NAO), the configuration of the polar jet stream, and the shift to neutral El Niño–Southern Oscillation (ENSO) conditions.
Europe wind power production limited by wind drought
While pockets of Sweden and Norway experienced stronger-than-average winds thanks to a positive phase of the NAO, most of Europe recorded a negative wind anomaly in the first half of 2025, significantly impacting the concentration of wind power assets between the UK and Denmark.
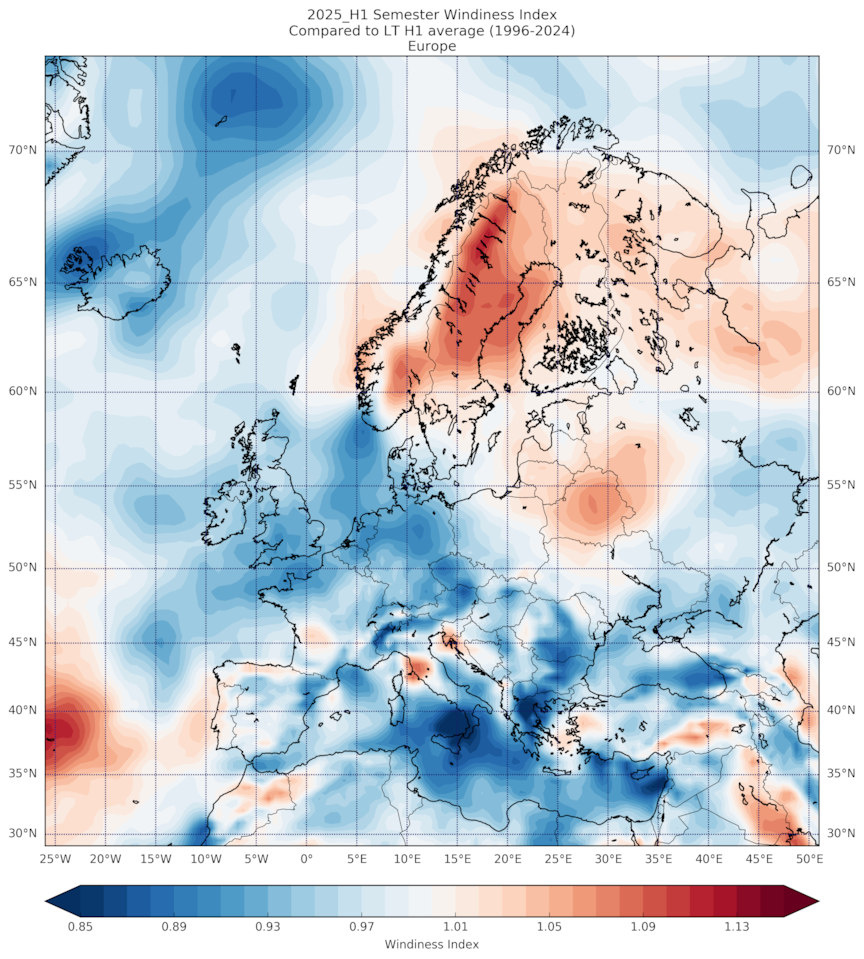
Wind anomaly for Europe, in Jan-Jun 2025, compared to the long-term average. Most of Europe saw below average wind, whilst Norway and Sweden saw positive anomalies.
The same atmospheric dynamics of the NAO contributed to a notable wind drought across southern Europe and parts of the North Sea, where windiness fell 4% to 8% below normal. This suppression of wind activity severely curtailed wind generation in key production areas, particularly in Germany, Spain, France, and the UK. The jet stream's poleward displacement redirected synoptic systems away from these regions, leading to prolonged calm spells. Wind operators in the central and southern North Sea also saw diminished wind output due to this steering effect, despite the typically supportive influence of a positive NAO.
Fortunately for energy grids in Europe, the negative anomaly from wind has been matched by a significant positive solar anomaly, where regions from Scotland to Turkey saw +15% more solar potential than the long-term averages.
Northeast US benefits whilst wind production in Great Plains is limited
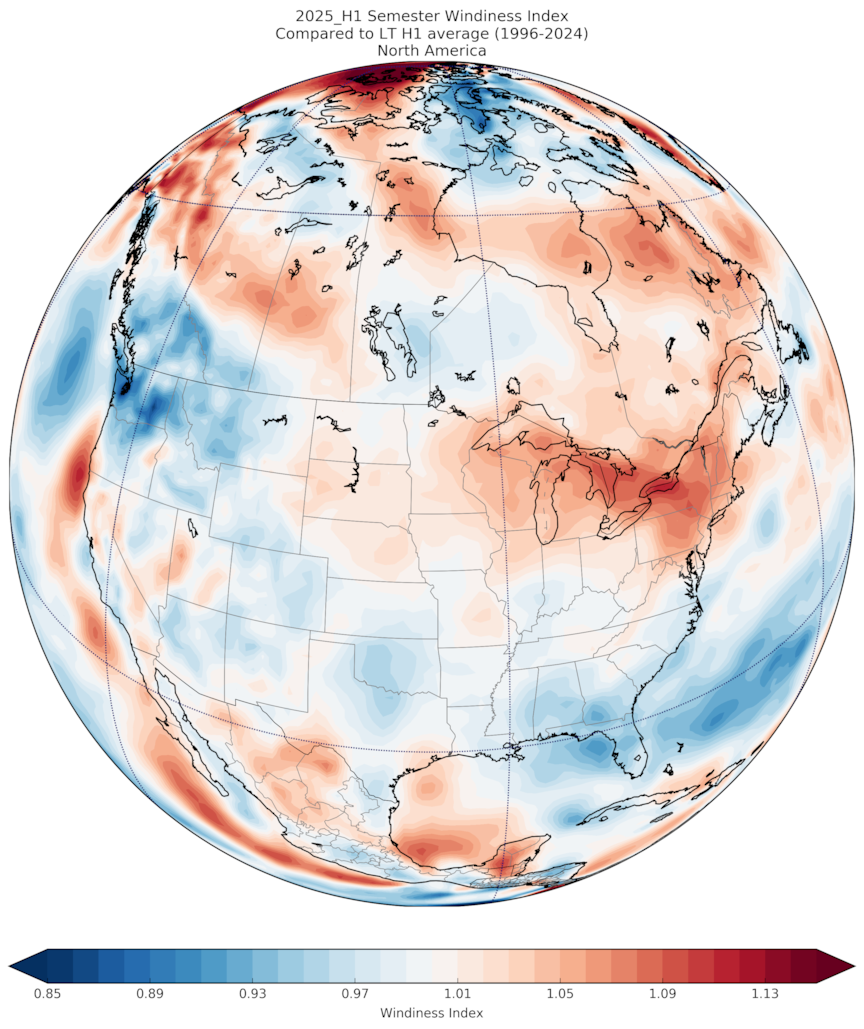
In the Northeastern US and Eastern Canada, winds were 7–10% above average as the polar jet stream carved a trough over the region, encouraging storm development through late winter and spring. These conditions would have supported stronger-than-expected output from wind projects in the region.
In contrast, the Great Plains, a key corridor for U.S. wind energy, experienced a wind deficit of 5-8%. This was primarily due to persistent upper-level ridging, which suppressed storm development and atmospheric mixing. The resulting calm reduced wind turbine productivity across much of the region, with impacts most pronounced during late Q1 and early Q2.
New Zealand wind production limited, whilst Australia variable
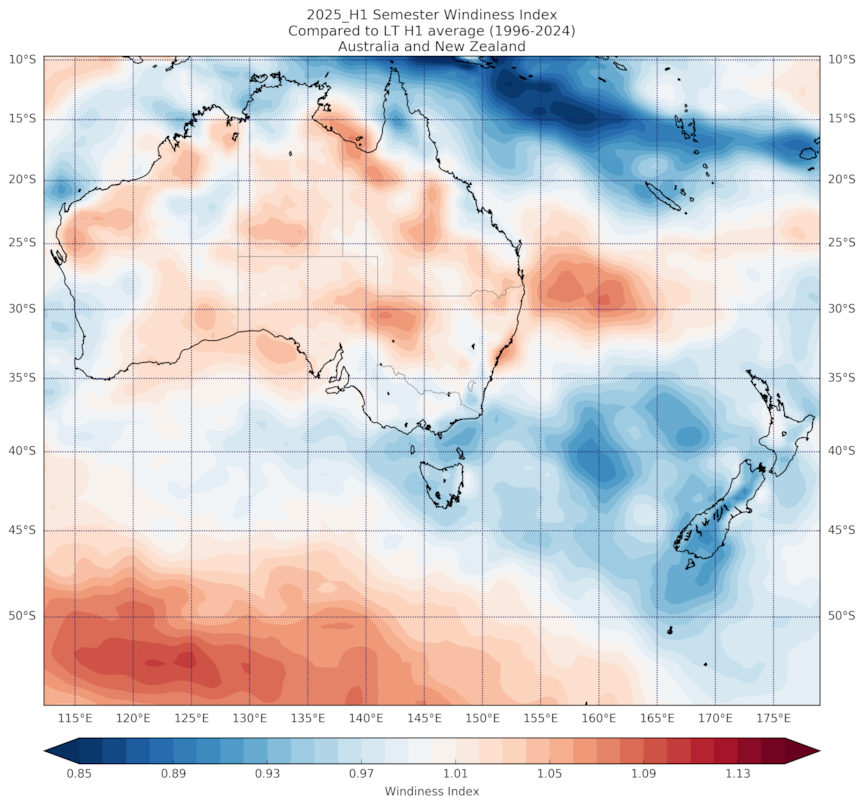
Australia and New Zealand showed no significantly impactful regional anomaly trends. While some regions registered above-average winds, national wind production was generally consistent with long-term norms. The stability is likely attributable to neutral ENSO conditions, which tend to reduce variability in southern hemisphere mid-latitude wind systems.
Indonesian windiness down 13% whilst China overperforms
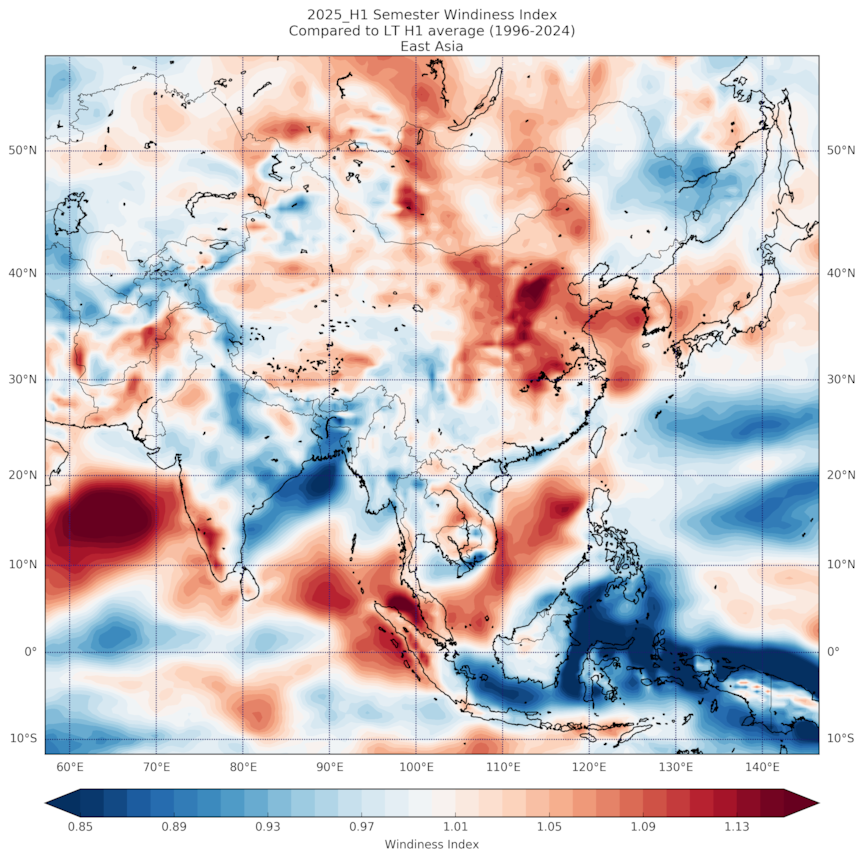
Wind generation in East Asia was notably impacted by a steep drop in windiness over Indonesia, where anomalies of −10 to −13% were recorded. With the Pacific trade winds dampened under neutral ENSO conditions, regional wind regimes weakened. This decline had clear implications for Indonesia’s growing wind sector, particularly in coastal and archipelagic zones dependent on trade-wind-driven flows. Western Indonesia, far offshore west of India, and parts of mainland China saw positive wind anomalies, though only China has notable wind power to have benefited from this increased windiness.
South American and Africa wind power potential was variable
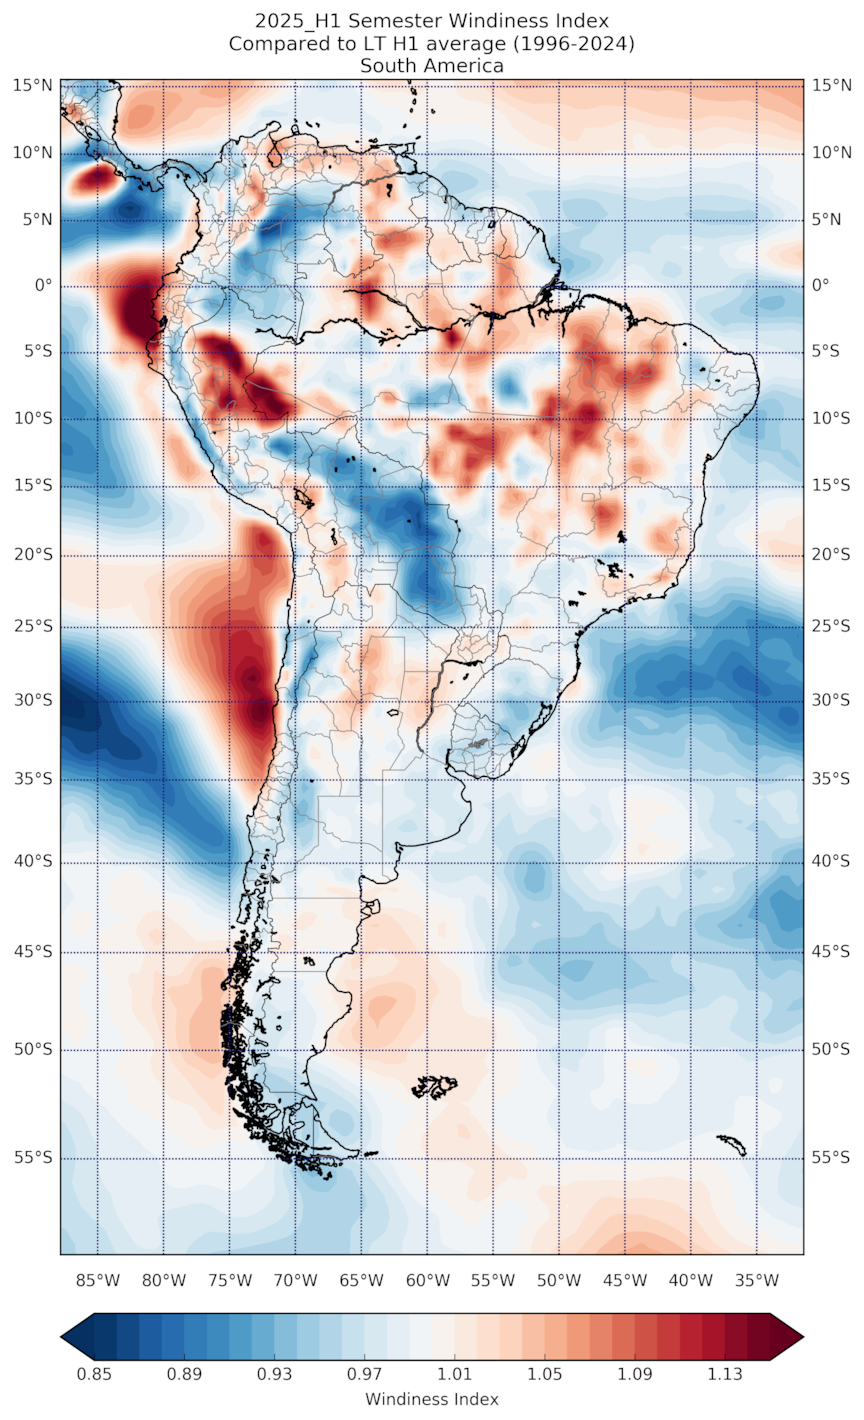
In South America, conditions were broadly near average. However, some enhancement of wind power potential was observed in parts of Brazil, Peru, and along the Chilean coast, where localized windiness exceeded historical baselines. These gains were not associated with a specific large-scale climate pattern, suggesting synoptic-scale variability or coastal thermal gradients played a more influential role.
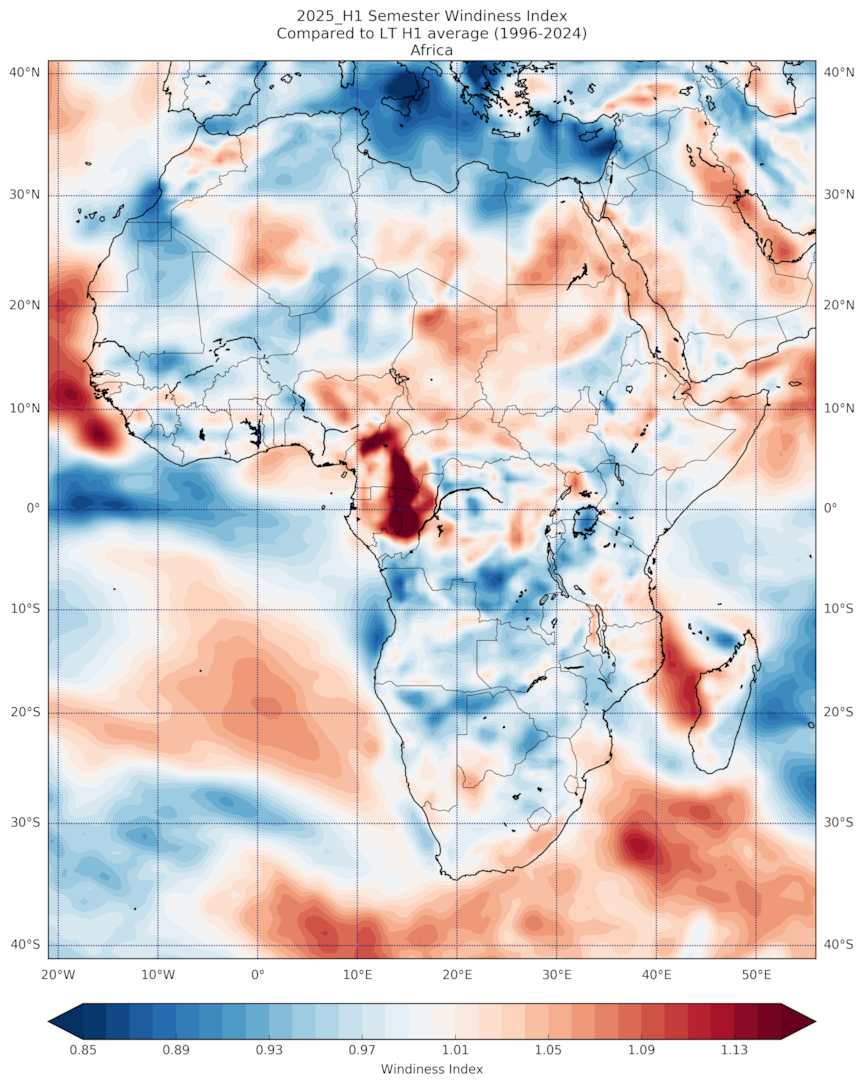
Across Africa, whilst there is not much wind capacity across the continent, wind resource conditions were divided between equatorial and sub-equatorial regions. The Republic of the Congo and Cameroon recorded windiness 8-10% above the long-term average. This increase was driven by a faster-than-usual northward progression of the intertropical convergence zone (ITCZ) between March and June. The resulting intensification of the pressure gradient between the equatorial low and the subtropical high enhanced surface wind speeds in central equatorial Africa.
Outside this corridor, however, wind resources were suppressed. Much of northern and southern Africa experienced windiness 3-7% below normal. The Harmattan, a key seasonal wind system, was weaker than average in the western Sahara due to a subdued high-pressure system. In southern Africa, the frequency and intensity of cold fronts, major drivers of wind variability, were also diminished during Q1. By Q2, the region transitioned to ENSO-neutral conditions, which are typically associated with lower wind system intensity, further contributing to a wind generation downturn.
Delivering global insights for informed decision making
The first half of 2025 underscored how sharply regional wind anomalies can swing renewable generation performance, from wind droughts in southern Europe and the Great Plains to stronger-than-average output in the Northeastern US, Norway, and parts of China. For asset owners, managers, and system operators, such variability can mean the difference between assets meeting performance expectations and falling short.
Learn how DNV can help decipher weather-adjusted asset performance
Understanding and adjusting for these weather-driven impacts is essential to assessing true portfolio performance, and uncertainty around weather variability can hide undiagnosed underperformance issues. DNV’s global data and advisory services provide the insights needed to separate climate-driven anomalies from operational factors, helping stakeholders make informed, weather-adjusted decisions for both wind and solar assets. DNV's green data products, including the team behind DNV Forecaster, who completed this global wind anomaly analysis, are delivering trusted data, models, and platforms for the global renewable energy industry, modelling energy and power for renewable portfolios, and markets all over the world. Speak to our team Ioannis Agiol and Doireann Kavanagh to learn more or explore weather anomaly data for your assets.