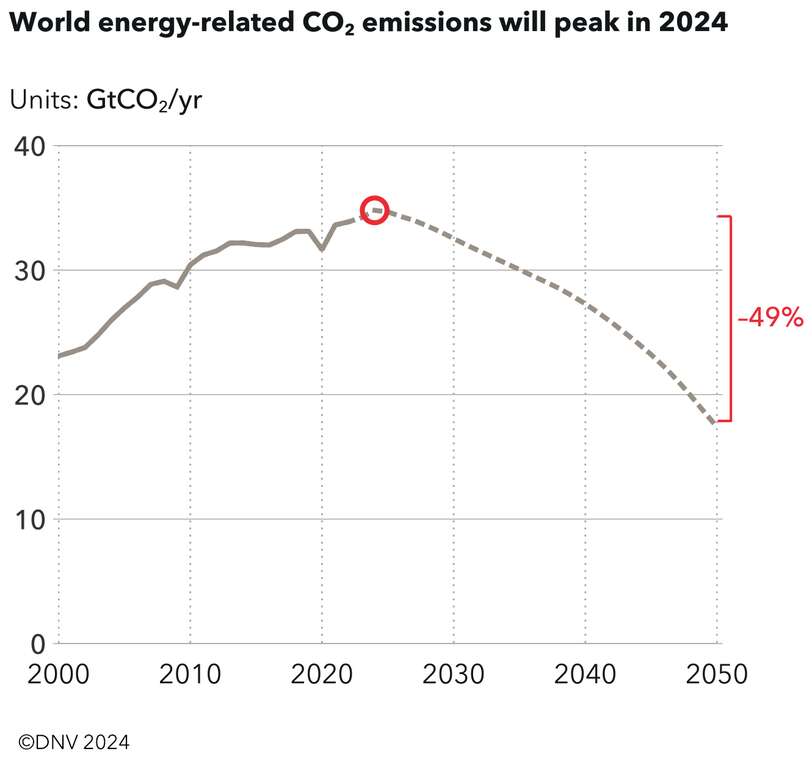
- 2024 is likely the year of peak emissions
- From next year, emissions are likely to decline for the first time since the industrial revolution and are set to almost halve by 2050
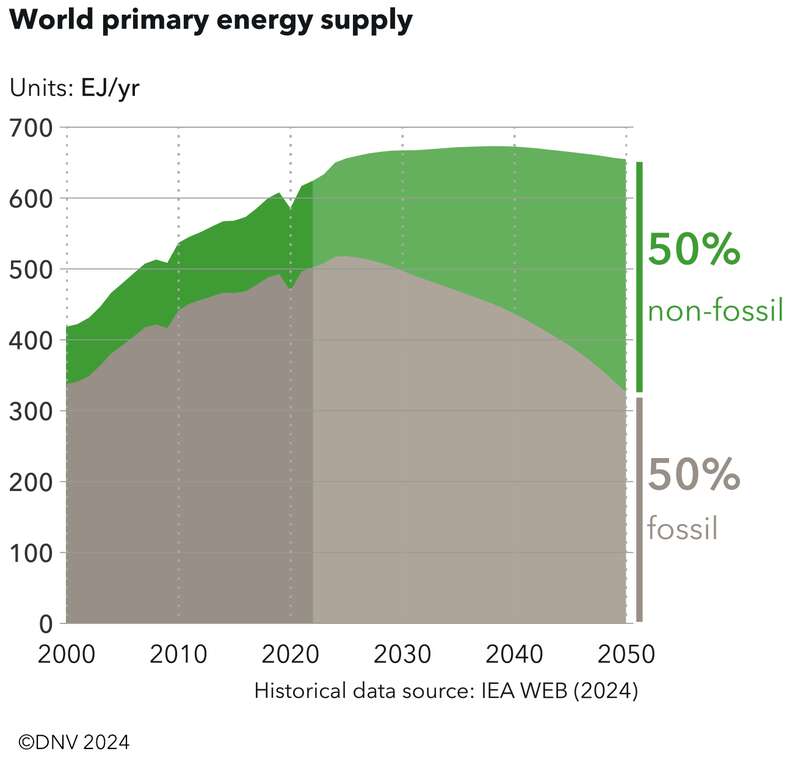
- The energy mix is moving from a roughly 80/20 mix in favour of fossil fuels today, to one which is split equally between fossil and non-fossil fuels by 2050
- This is still a long way short of requirements of the Paris Agreement.
- Renewables grow 2.2x from now to 2030, well behind the COP28 goal of tripling
- We forecast the planet will warm by 2.2 °C by end of the century

- Rapid growth of solar PV and batteries, but slow developments in CCS and hydrogen
- Plunging costs of solar and batteries are accelerating the exit of coal from the energy mix and stunting the growth of oil
- Annual solar installations increased 80% last year as it beat coal on cost in many regions
- Wind remains an important driver of the energy transition, contributing to 28% of electricity generation by 2050, with offshore wind growing 12% annually
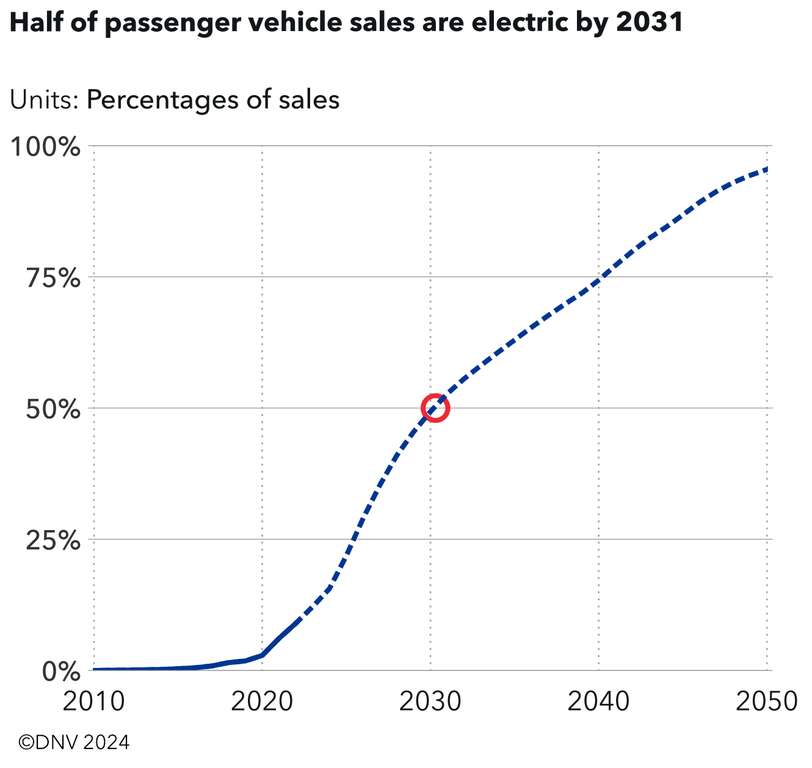
- EV sales increased 50% last year and are on track towards a 50% global passenger EV sales share in 2031.
- Clean technologies for hard-to-abate sectors are struggling
- Hydrogen and its derivatives are likely to account for only 4% of final energy demand in 2050 – while our forecast last year was 5%
- Whilst we are slightly more optimistic than last year about carbon capture and storage, only 2% of global emissions will be captured by CCS in 2040 and 6% in 2050


- Chinese clean tech speeds up the transition, but faces a tariff backlash
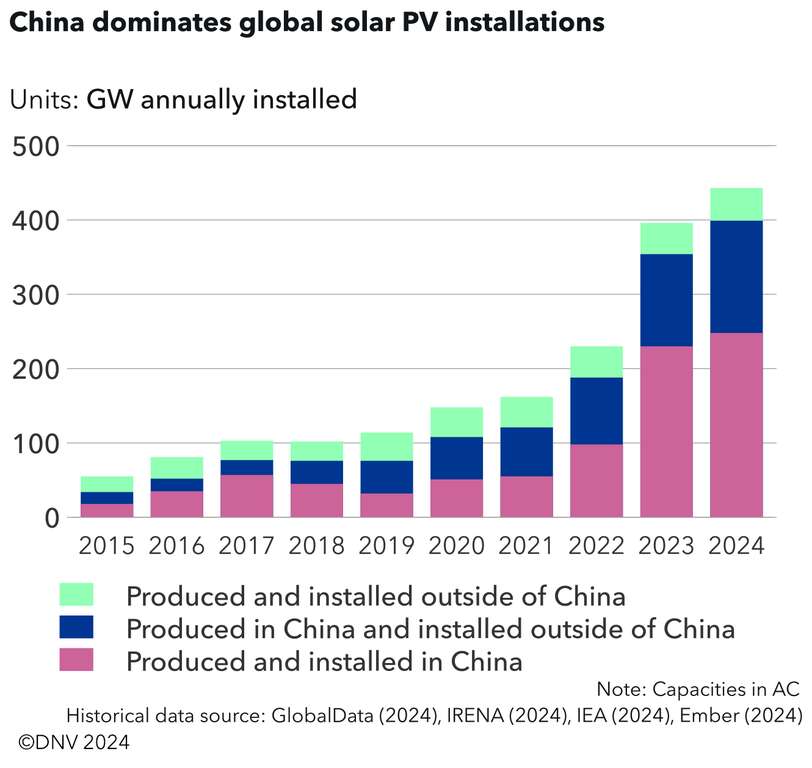
- China accounted for 58% of global solar installations and 63% of new electrical vehicle purchases last year
- Whilst it remains the world’s largest consumer of coal and emitter of CO2, China’s dependence on fossil fuels is set to fall rapidly as it continues to install solar and wind.
- In many countries, there is a heightened security focus and diversion of national budgets towards military spending and away from government support for the transition
- High borrowing costs, albeit slightly easing, continue to squeeze public budgets and prolong a cost-of-living crisis in many individual households

Explore the full report for details on many other aspects of the development of the global and regional energy systems. Or explore the Executive Summary for answers to common questions about the transition clean energy.
Independent view
DNV was founded in 1864 to safeguard life, property, and the environment. We are owned by a foundation and are trusted by a wide range of customers to advance the safety and sustainability of their businesses. 70% of our business is related to the production, generation, transmission, and transport of energy. Developing an independent understanding of, and forecasting, the energy transition is of strategic importance to both us and our customers.
This Outlook draws on the expertise of over 100 experts in DNV and many external experts.
More details on our methodology and model can be found in the report.


