DNV’s Playbook for IRA Home Energy Rebate Program Success: 4. The Open-Source Technology Challenges of the Home Efficiency Rebate Measured Path
In DNV's last entry in our Playbook for IRA Home Energy Rebate Success, we detailed 4 key workflow automations which maximize customer benefit and minimize application review. Within, we discussed how customers could benefit from a home energy model even in a measured path by setting clear savings expectations. For states, this approach could also put a confidence coefficient next to the savings value the state reserves with the Department of Energy (DOE). The measured path in all stages of its implementation is an exercise in establishing confidence: confidence that the state can utilize the infrastructure and partnerships in place to collect and measure savings; confidence that the original scope of work will meet savings targets; confidence that the customer will best benefit from this path; and confidence that the chosen open-source measurement and verification (M&V) software can be used effectively to calculate final rebates. This last item, the selection of open-source M&V software and its application, might be the most challenging. Spoiler: there may be only one suitable tool in the DOE’s final approved software list. And, to maximize its effectiveness within the program, several not-so-simple circumstances need to align.
Best-Case Scenarios for the Measured Path
States should weigh the pros and cons of adopting this path against the overall benefit to future program participants and be confident they can mitigate these risks. Given the pros of the measured approach (verified savings at the meter) and the cons of the measured approach (implementation complexity), here are some key scenarios that most fully enable the measured path, and under which states may find that the benefits outweigh the costs.
- Contractor management - working through managed networks of contractors is a proven model to deliver energy saving projects. The measured approach, however, may be an additional layer of complexity for contractors to navigate. Contractors may have concerns about cashflow to their business if rebates cannot be paid until one year after the project has been completed and the savings have been verified. The measured approach works best in areas where there are established sophisticated contractor networks that have experience navigating these types of programs.
- Promoting equity - the measured approach works best when household energy consumption data can be easily transferred. However, not all households have been served by program-enabling smart meter infrastructure. Meter-verified savings are still possible with paper bills, but this places an additional administrative burden on the program and raises costs – it could also place a burden on the program applicant to provide historical paper billing data. The measured approach works best in areas with equal distribution of smart meters.
- Technology solutions - clean energy programs are enabled by technology systems that track and report project data. If utilities are unable or unwilling to share data or integrate with state programs and their technology platforms, the measured approach will take more effort than if it were enabled by automatic data flows. Furthermore, many of the benefits of the measured approach accrue to utilities – not just the applicant households – by capturing actual savings at the meter, relieving pressure on the grid, and potentially enabling utilities to set up capacity markets to capture these benefits. As such, the measured approach works best in states where there is close coordination between energy offices and utilities.
In these ideal scenarios, states may wish to implement the measured approach as part of their Home Efficiency Rebate (HER) program design.
The Path Toward the Measured Path
The definition of the measured path of the Home Efficiency Rebate Program (50121) is seemingly straightforward – energy usage is assessed before and after the completion of a project, and the difference in energy consumption determines the final rebate amount. After the final true up at the meter, the weather-normalized energy savings must be at least 15%, compared to the 20% estimated threshold of the modeled pathway. The ease in which states will be able to enact this measurement and verification begins with data sharing agreements1 between the state and the utilities, cooperatives, and municipalities within their boundaries. These agreements set expectations for how to securely bridge the data collected at the physical meters to the states or supporting partners implementing the measured path programs.
For states without AMI or smart meter infrastructure, approximately 27% of residential customers in the United States2, the granularity of the data shared will likely be limited to consumption data found on utility bills. It’s important to note that the available granularity – hourly, daily, or monthly – can potentially impact the final true up when normalizing the energy consumption for temperature rather than a simple 12-month total before intervention minus the 12-month total after intervention calculation, as we’ll see later. By leveraging existing standards and solutions such as the Green Button Standard or UtilityAPI, the task of connecting consenting utility customers and their data to state programs is made easier, even for utilities and states with no prior experience with either3. Once the data is securely shared, the final step is selecting a DOE-approved open-source advanced M&V software and using it to calculate the metered savings at least 9 months after the completion of a project4. It is this last fork along the path – the selection of an M&V software and its ease of application – that warrants further explanation below.
The State of Free Open-Source Tools
The market for free open-source5 M&V software is highly specialized, resulting in a limited number of available tools6:
- OpenEEMeter – A python-based Linux Foundation Energy project. It features model selection, data completeness checks, allows for flexible data sources, and provides model serialization. Beyond energy efficiency M&V, OpenEEMeter is also intended to determine the impact of demand response and energy storage or load shifting programs.
- ECAM - (Energy Charting and Metrics) is a Microsoft Excel tool developed by the Pacific Northwest National Laboratory (PNNL) to analyze and visualize energy consumption data, including advanced M&V. Most resources and guides are from prior to 2018 but still accessible. Any Excel tool is limited in its ability to scale to a state-wide program with potentially hundreds or thousands of projects. Lastly, ECAM’s ability to meet the DOE definition of open-source is a matter of perspective, since it is an Excel plug-in and the underlying parameters can be modified.
- RMV2.0 – An R-based graphical user interface (GUI) designed for advanced M&V, specifically for commercial buildings. Developed by the Lawrence Berkeley National Laboratory. In our testing, RMV2.0 would not run a current or recent version of R, with contributors commenting on open issue tickets within the GitHub repository that users should try and install R3.6.3, released in February of 2020. Even with that version, we ran into several compatibility issues with R3.6.3 and RMV2.0’s required dependencies.
- Universal Translator – Developed by PG&E’s Pacific Energy Center and Lawrence Berkeley National Laboratory with contributions from National Institute of Standards and Technology and Quantum Energy Services & Technologies Inc. At the time of writing, we were unable to download a version of Universal Translator from their site, which was last updated in 2017. A user may request a login from the site’s webmaster, but no response was returned from our request, and with that we were unable to get a link to download Universal Translator.
- NMECR – An R-based code-only toolset for performing site-specific advanced M&V. The code is supported by kW Engineering, and freely available on their GitHub. It is intended to be used in the commercial and industrial sectors, contains eleven energy modeling algorithms, and a set of “vignettes” or example use cases to apply to your own applications. Notably, there are contributions to their code repository within the last year.
Figure 1. Comparison of free and open-source M&V software

For the purposes of this blog post, we will limit our focus to OpenEEMeter due to its potential to scale to a state-wide program, intended application for residential use, and that it is both free and open-source. OpenEEMeter is, for all intents and purposes, the commonly cited example of what the DOE means when it specifies a DOE-approved open-source advanced M&V software. At the time of publication, however, the DOE has not released its approved software list. In the M&V software space, OpenEEMeter is ubiquitous for allowing a user to take energy measurements and temperature data to determine the impact of an energy efficiency technology installation. It does this by first modeling a home’s performance baseline, and then modeling both the impact of the technology on the home’s energy usage and the hypothetical of what the home’s energy usage would be without the project installation. For its application in an IRA measured context, OpenEEMeter can calculate weather-normalized avoided energy consumption in contrast to only adjusting usage data for temperature fluctuations or only modeling avoided energy use.7 Despite its popularity, however, developers should note that the documentation found on OpenEEMeter’s GitHub repository has not been updated in the past 3 years despite active contributions to its codebase. This lagging documentation surfaces two issues worth bearing in mind: firstly, IRA stakeholders should consider contributing to open-source solutions by either developing their own within this space or enhancing existing solutions such as OpenEEMeter; and secondly, that states should push for out-of-the box functionality (meaning the code can be easily leveraged using the accompanying documentation) when choosing open-source software for their programs to maximize their administration dollars.
Open-source software, while a cost-effective way of empowering the measured savings approach, can also present hurdles for states and implementors due to the extra development hours required to solve for missing or lacking documentation. The turn-key nature of these open-source tools is especially relevant to avoid the misuse of the complex algorithms and models within, potentially jeopardizing accurate energy savings calculations. Currently OpenEEMeter occupies the open-source space here, but privatized alternatives like DNV’s KobleStats8 can drive competition in this space and more fully enable the DOE’s Home Energy Rebate Programs if they are open-sourced to meet the DOE criteria. The DOE mandates open-source M&V software, but beyond compliance, states should explore diverse solutions.
Energy Data Infrastructure, Granularity, and Project Outcomes
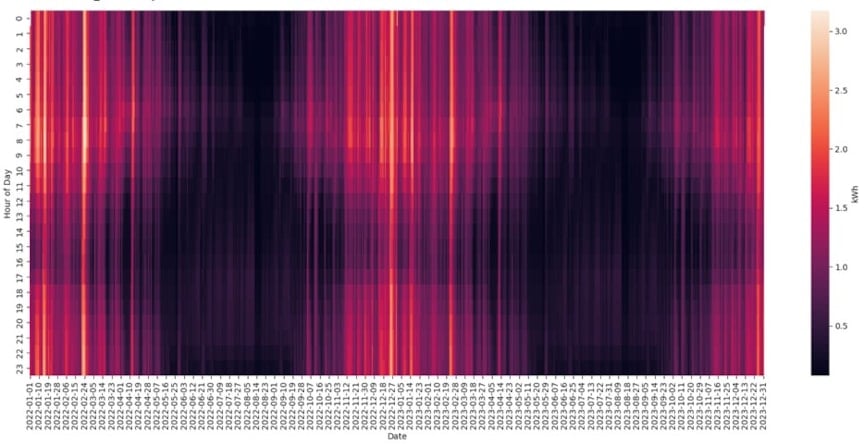
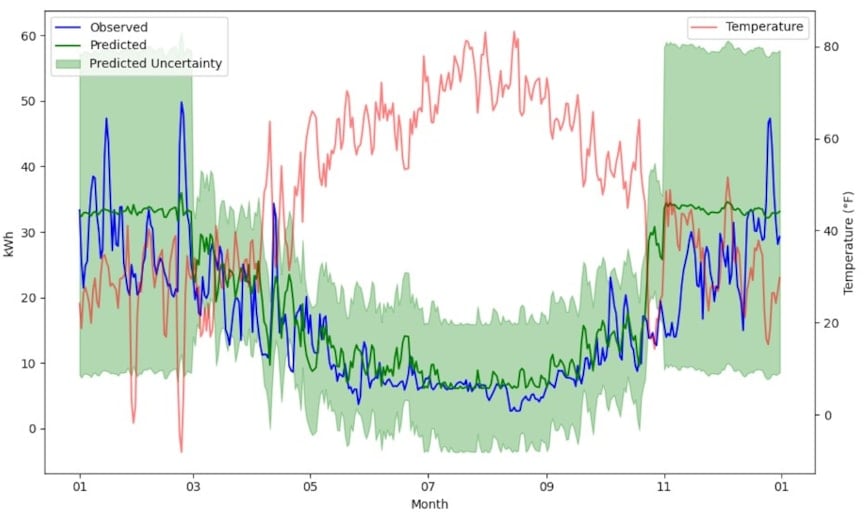
As noted above, the granularity of available energy data infrastructure within the state can impact a temperature-normalized metered energy savings calculation. By taking an example residential hourly load profile from the National Renewable Energy Laboratory’s (NREL) “End-Use Load Profiles for the U.S. Building Stock”9, reducing the heating specific load by 20% in the second year, joining it to temperature data for that location, and running it through OpenEEMeter’s tutorial notebook10 at hourly, daily, and monthly input scenarios we see differing results.
Figure 2. Example 24-Month Residential Consumption Data (Source: NREL End-Use Load Profiles for the U.S. Building Stock)

This example was produced without any calibration to OpenEEMeter’s parameters, and only fed through the out-of-the-box tutorial as a simple example to demonstrate that the energy data infrastructure in place within the state can have an impact on the final calculation, and that the calculation itself will need to be vetted by states and their implementation partners to ensure it best serves the program and its participants. These steps are essential to establishing confidence in the accuracy and effectiveness of the energy savings calculations, thereby ensuring the approach meets the program’s stringent standards and serves its participants through a final rebate calculation.
Figure 3. Predicted vs Observed Daily Model Example Output from OpenEEMeter Tutorial Notebook.

Figure 4. Metered kWh savings output compared to OpenEEMeter measured savings at different data input granularities.
| Savings (kWh) | |||
| Metered Savings | Hourly Output | Daily Output | Monthy Output |
| 1,168.03 | 1,023.47 | 1,225.94 | 870.23 |
| Difference | 144.55 | (57.91) | 297.80 |
The measured pathway of the Home Efficiency Rebate Program is an opportunity for states to take a data-driven approach to measuring the overall success and impact of their program. Technology has been at the heart of implementing sound and impactful energy efficiency programs for years, and using technology in this way, in this context, is an opportunity for states to advance how demand response programs are run at scale in the U.S. This potential advancement, however, should come with a caveat that states should do so with eyes wide open to the potential pitfalls and risks inherent to the measured pathway – including their very limited open-source software options. As states seek to roll out the measured approach of their HER programs, a few crucial next steps will best position these programs for success:
- States should proactively do what is necessary to put data sharing agreements in place between themselves and the utilities to ensure the energy data infrastructure is present to enable the measured path.
- States should push for the DOE to finalize its list of approved open-source advanced M&V software.
- States should push for open-source software maintainers to keep both code and associated documentation up to date.
- States should seek to partner with organizations that can support the design and implementation of these programs and streamline the technical complexity to maximize participant benefit and minimize costs.
Putting these suggestions into practice is more challenging to accomplish than to discuss. DNV is here to help. Our Technology team brings 20+ years of experience developing software to deliver both consulting and software-as-a-service (SaaS) solutions enabling the successful implementation of rebate programs. DNV's recent acquisition of ANB systems further solidifies our strength in this area. ANB Systems, a prominent SaaS company founded in 1997, brings DNV even more robust workflow tracking tools, digital TRMs, and AI-driven automation to reduce chances for human error and shorten application review and payment cycles.
DNV can trace its contributions to the roots of measured-savings methods and their commercialization11. It is our foundational understanding of these methods, their various iterations, and decades of use and analysis that sets DNV apart in our ability to effectively manage and deliver on these programs. Connect with our team to discuss how we can help you design and implement the most impactful technological solutions as part of your IRA programs.
Notes
- The DOE provides Data Access Guidelines here: https://www.energy.gov/sites/default/files/2023-07/IRA-50121-Home-Efficiency-Rebates-Data-Access-Guidelines-1.0.pdf
- According to 2022 EIA Form 861 data, 73% (104,752,488 homes) have Advanced Metering Infrastructure (AMI) of the total 144,091,470 residential homes. The remainder are AMR (Automated Meter Reading) or non-standard meters.
- The topic and complexity of utility data access agreements warrants its own blog post. In some states it may pose as much of a challenge as performing M&V. It is not uncommon for a state to have over 20 utility, co-op, and municipal energy providers.
- The DOE notes that if the measurement window is less than 12 months, the window of at least 9 months must include at least one peak energy season, or both peak energy seasons in a dual-peaking climate. See 3.2.4.2 of the Home Energy Rebate Programs Requirements & Application Instructions for additional details.
- DOE’s guidance on Open-Source from V1.1 of Program Requirements & Application Instructions is, “source code that is made freely available for possible modification and redistribution, for use by the community at large.”
- A 2020 NEEP webinar describes, at that moment in time, the landscape of M&V and the tools available: https://neep.org/sites/default/files/resources/Protocols%20for%20Advanced%20M%26V%204.30.20%20Final.pdf
- This method, OpenEEMeter’s weather-normalized counterfactuals based on the 12 months of energy usage before the Program intervention is what is prescribed in the Flex Coalition’s “Program in a Box” guide to measured savings: https://flexcoalition.org/wp-content/uploads/Measured-Savings-Program-Implementation-Guide.pdf
- KobleStats is DNV’s purpose-built billing analysis toolkit. KobleStats unlocks at-scale M&V using billing and AMI data, reducing the time it takes to determine site-level energy consumption models. In particular, it excels at performing advanced M&V for batches of hundreds of thousands of sites. This allows M&V teams to focus efforts on exploring the complexities in the data and testing sensitivities to different assumptions (e.g., testing an alternative approach to comparison group assignment, or integrating engineering-adjustments for specific sites).
- NREL’s End-Use Load Profiles for the U.S. Building Stock can be found here: https://www.nrel.gov/buildings/end-use-load-profiles.html
- The tutorial notebook is currently the most up to date documentation source for OpenEEMeter 4.0. The repository’s readme.rst was last modified in March, 2021. As of the time of publication an issue ticket has been created noting the out-of-date documentation, with code contributors pointing the issue reporter to the tutorial.
- Agnew, K.; Goldberg, M. (2017). Chapter 8: Whole-Building Retrofit with Consumption Data Analysis Evaluation Protocol, The Uniform Methods Project: Methods for Determining Energy Efficiency Savings for Specific Measures. Golden, CO; National Renewable Energy Laboratory. NREL/SR-7A40-68564. http://www.nrel.gov/docs/fy17osti/68564.pdf
