Energy Transition Outlook 2025
This region consists of Australia, New Zealand, Japan, and South Korea.
| 2024 | 2060 | |
| Population | 206 million | 181 million |
| GDP* | USD 11 trillion | USD 13.8 trillion |
| GDP/person | USD 53 500 | USD 76 500 |
| Energy use | 35 EJ | 19 EJ |
| Energy use/person | 170 GJ | 160 GJ |
| CO2 emissions** | 2 Gt | 0.2 Gt |
| CO2 emissions/person | 9.7 tonnes | 1.1 tonnes |
*All GDP figures in the report are based on 2017 purchasing power parity and in 2023 international USD.
**Energy- and process-related CO2 emissions, after CCS and DAC.
The OECD Pacific faces surging electricity demand and accelerating renewable energy growth, but persistent fossil-fuel dependence, grid constraints, and policy uncertainties require coordinated solutions to balance energy security with decarbonization goals.
Current situation
82
%
Fossil fuels
in primary energy supply in 2024
95
%
Import reliance
Japan and South Korea both rely on over 95% foreign fossil-fuel sources
26
%
Renewable sources
in power generation
1.5
bn
Losses (USD)
in Australia due to back-to-back disasters in H1 2025 alone
- Fossil fuels make up 82% of primary energy supply in the region. In 2024, coal, oil and natural gas accounted for 61% of power generation and 70% of energy use in demand sectors .
- Import dependence is high with Japan and South Korea relying heavily on foreign fossil-fuel sources – 97% and 98%, respectively. In LNG, they follow China as the world’s largest importers. Australia exports coal and gas but imports most of its oil.
- Non-fossil energy has nuclear capacity at 64 GW, accounting for 13% of electricity, and 12 GW under construction in Japan and South Korea (GEM, 2025). Renewable energy sources account for 26% of power generation – but reached 36% in Australia and 86% in New Zealand.
- Climate risks include floods, sea-level rise, heatwaves and bush fires. Economic costs from climate-related extreme weather events were USD 90.8bn in Japan, 2014-2023 and USD 33.7bn in Australia (Oxera, 2024). Back-to-back disasters cost Australia around USD 1.5bn (AUD 2.2bn) in H1 2025 alone (CCA, 2025).
Pointers to the future
- Geopolitical uncertainty is prompting policy reassessments across the region given high fossil fuel or technology import dependence, including supply-chain risks from reliance on Chinese components, such as in Korean semiconductor chips and electric batteries.
- Japan and South Korea are reinvigorating nuclear power and LNG is key to bolster energy security. Hydrogen policy momentum is maintained, and also pursued through imports, such as Japan with bilateral agreements in hydrogen offtake and the Clean Hydrogen and Ammonia Corridor with India (GH2 India, 2025), and South Korea’s multi-pronged approach considering price alongside emission intensity grades in auctions, applied to both domestic and imported hydrogen. Australia advances hydrogen export partnerships with both nations, though investment uncertainty persists.
- Electricity demand is rising driven by industrial electrification and hydrogen developments. South Korea’s 11th Basic Plan for Electricity Supply and Demand (2024–2038) from March 2025, outlines growth in carbon-free power sources – nuclear, renewables, hydrogen, and ammonia. Regionally, offshore wind is gaining traction. South Korea’s latest 1.25 GW tender includes national security-linked local content criteria, and also Japan’s revised auction rules aim to boost local content in its 10+ GW pipeline. Australia’s postponed offshore wind auction in Victoria raises concerns about coal phase-out timelines.
- Sector-specific decarbonization strategies are advancing, backed by substantial funding and evolving carbon markets. For example, Japan’s Green Transformation (GX) plan allocates over USD 1trn (JPY 150trn) to support innovation in emerging technologies and nascent industries including carbon capture. The GX 2040 Vision (METI, 2025a) emphasizes supply security, economic growth, and carbon neutrality.
- Australia’s 2025 election reaffirmed energy transition goals. The Electricity and Energy Sector Plan 2025 outlines the phased approach to 2050 from electrification underpinned by renewable power (82% ambition by 2030) to renewable gases, low carbon liquid fuels, and carbon capture and storage (CCS) supported for hard-to-decarbonize sectors (Australian Government, 2025a,b). New Zealand shares similar priorities, building on high renewable electricity penetration (100% ambition by 2030). The second emissions reduction plan to 2030 (New Zealand Government, 2024) specifies the role of CCS in meeting emissions budgets, and the regulatory framework is evolving.
The energy transition indicators
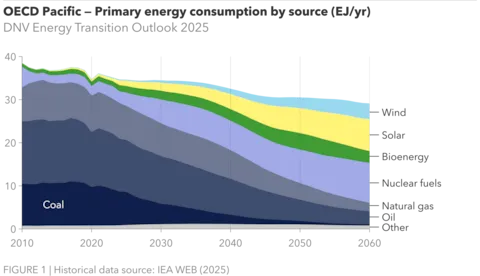
Primary energy consumption (EJ/yr)
Fossil fuels currently dominate the primary energy mix in OECD Pacific, accounting for 82% of total consumption. However, their share is projected to decline significantly by 2060, falling to just 18%. This reduction will be offset by a substantial rise in renewable and nuclear energy sources. Nuclear will play a major role, making up 32% of the mix in 2060 while solar and wind are expected to be the fastest-growing sources, reaching 25% and 12%, respectively.
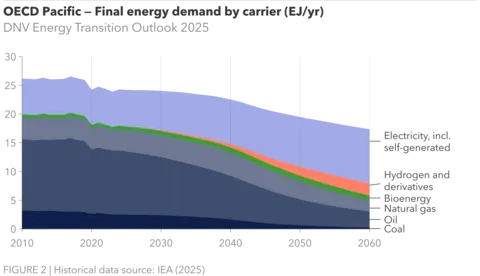
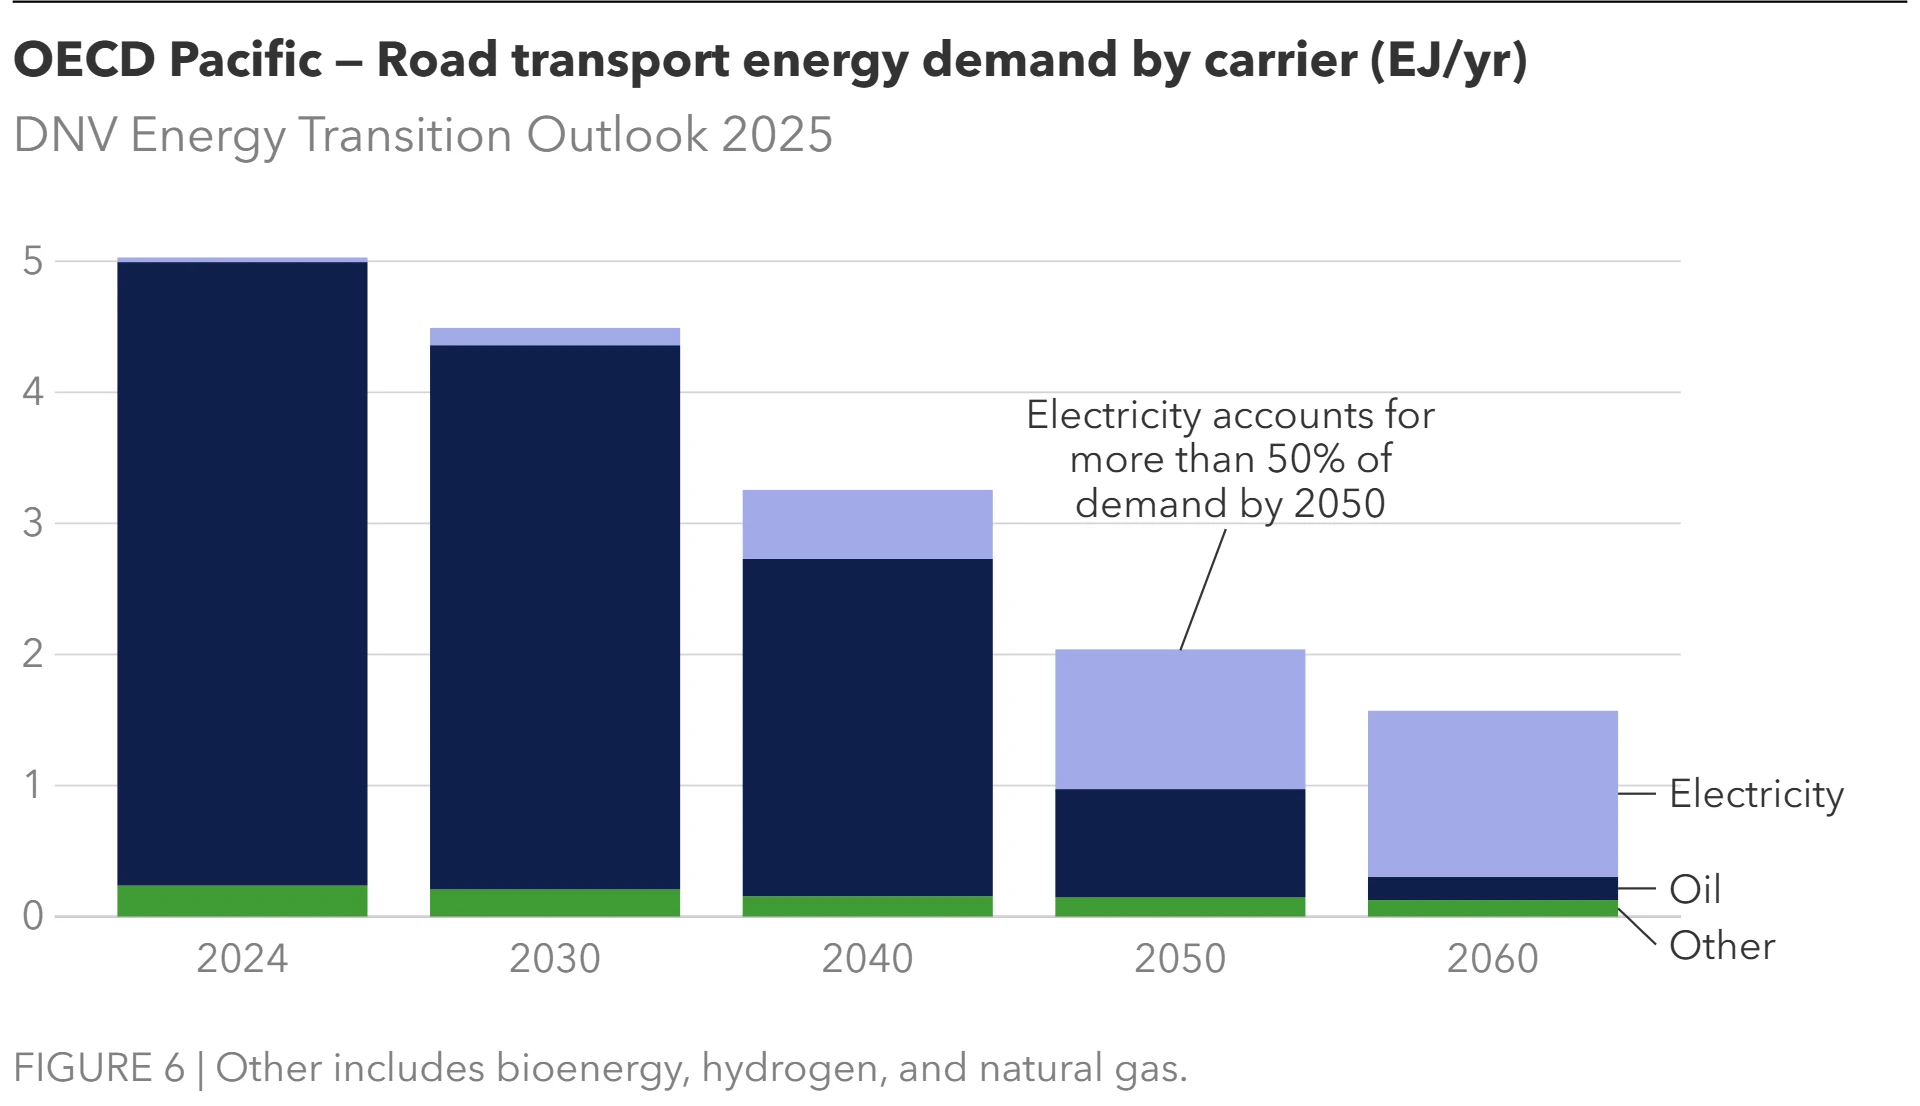
Final energy demand (EJ/yr)
Final energy demand is similarly dominated by fossil fuels, accounting for 70% of today’s energy demand. Over the coming decades, demand will decrease from 25 EJ to 18 EJ, driven by population decline, electrification, and efficiency gains. Electricity grows rapidly and overtakes fossil fuels, making up over 50% of final energy demand in 2060. Oil's share drops significantly, but will still represent 16% of demand in 2060, reflecting its continued, though reduced, role.
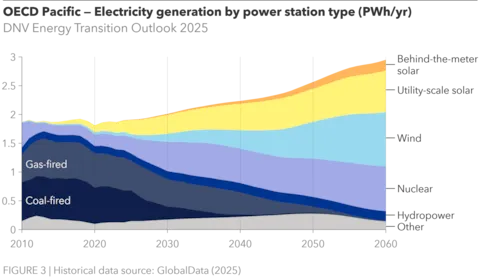
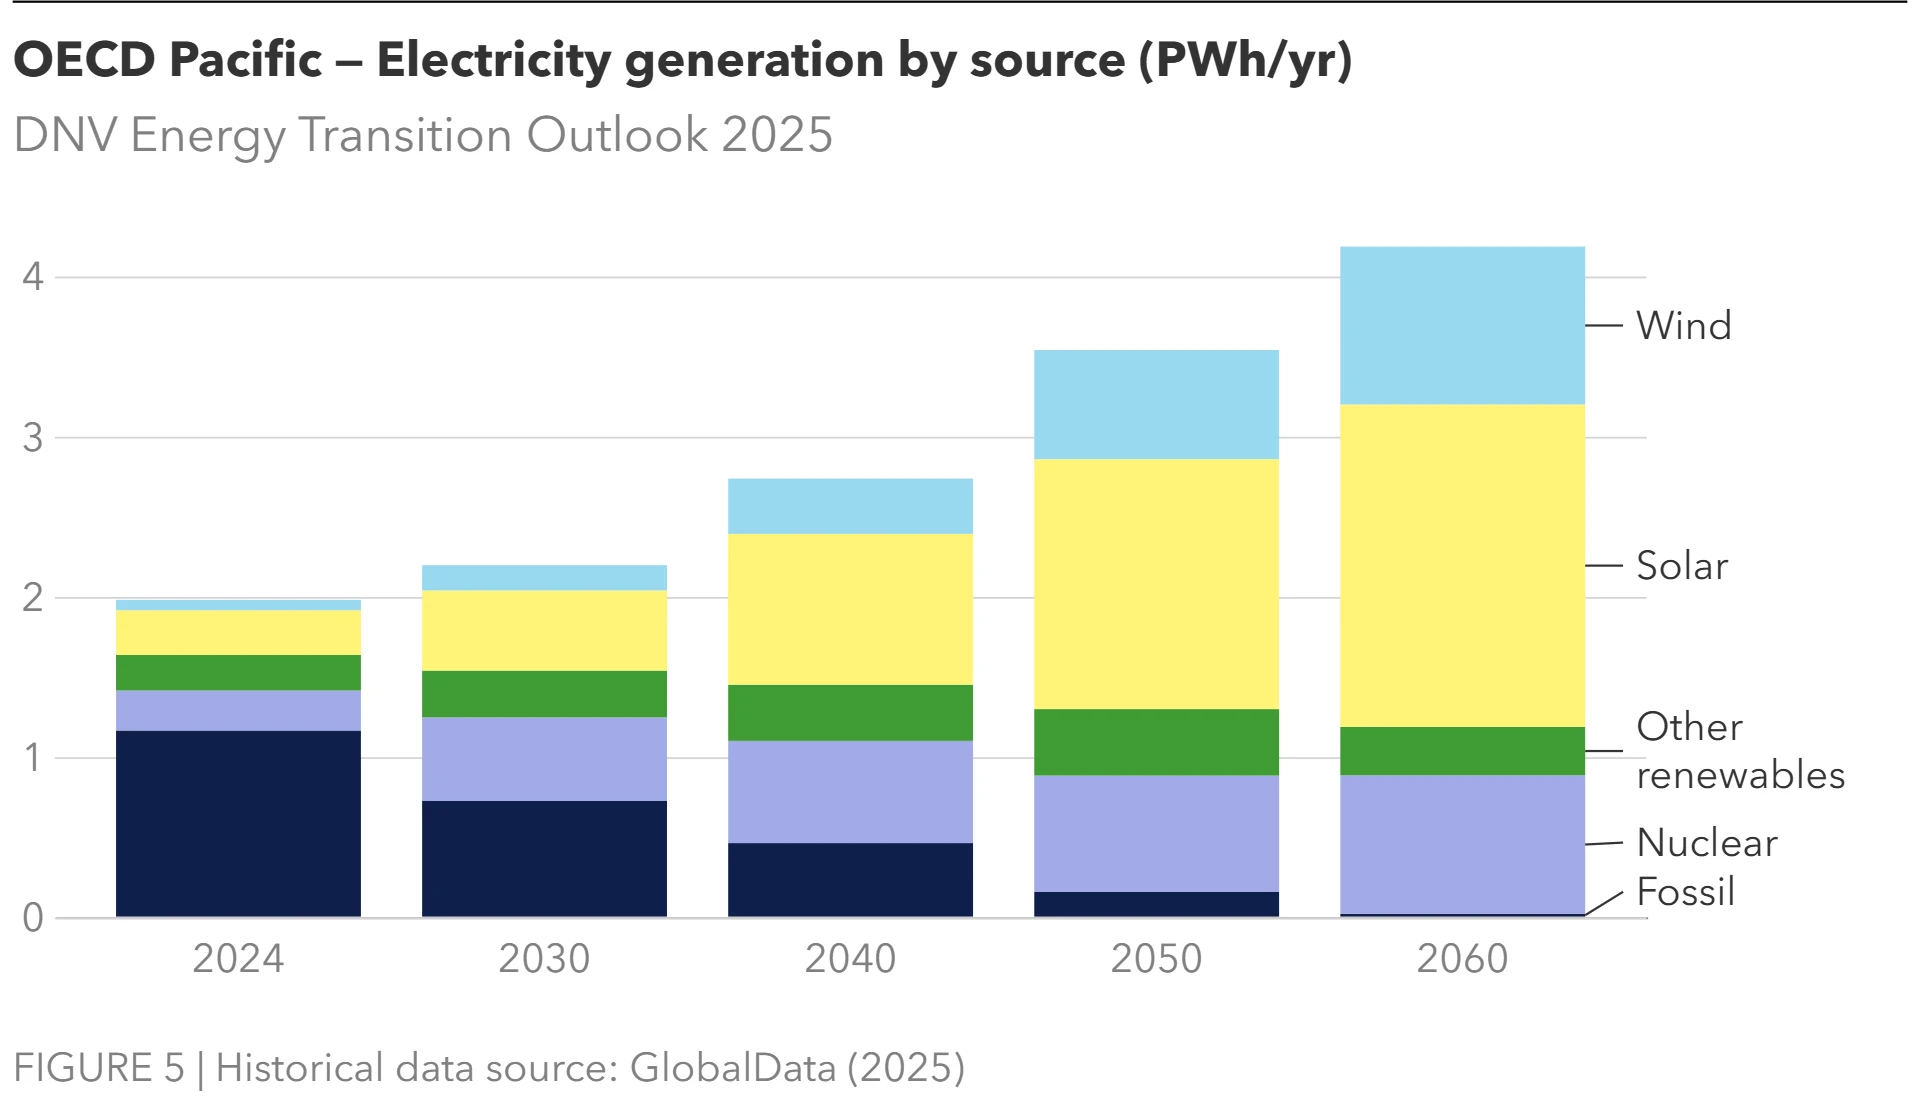
Electricity generation (PWh/yr)
OECD Pacific’s electricity generation will increase by 59% by 2060, while the electricity mix changes drastically from 60% fossil fuels today to less than 1% in 2060. Significant growth will come from wind, increasing more than a 10-fold from 2024 levels to reach31% in 2060, and solar almost quadrupling to 24%. Nuclear, increasing from 14% in 2024 to 25% in 2060, will also become a major source of electricity in the future mix.
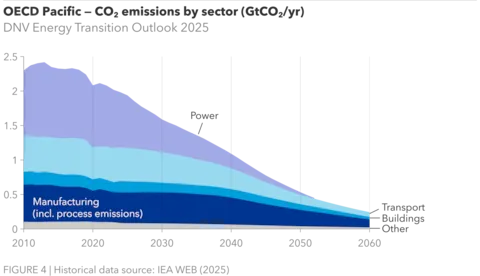
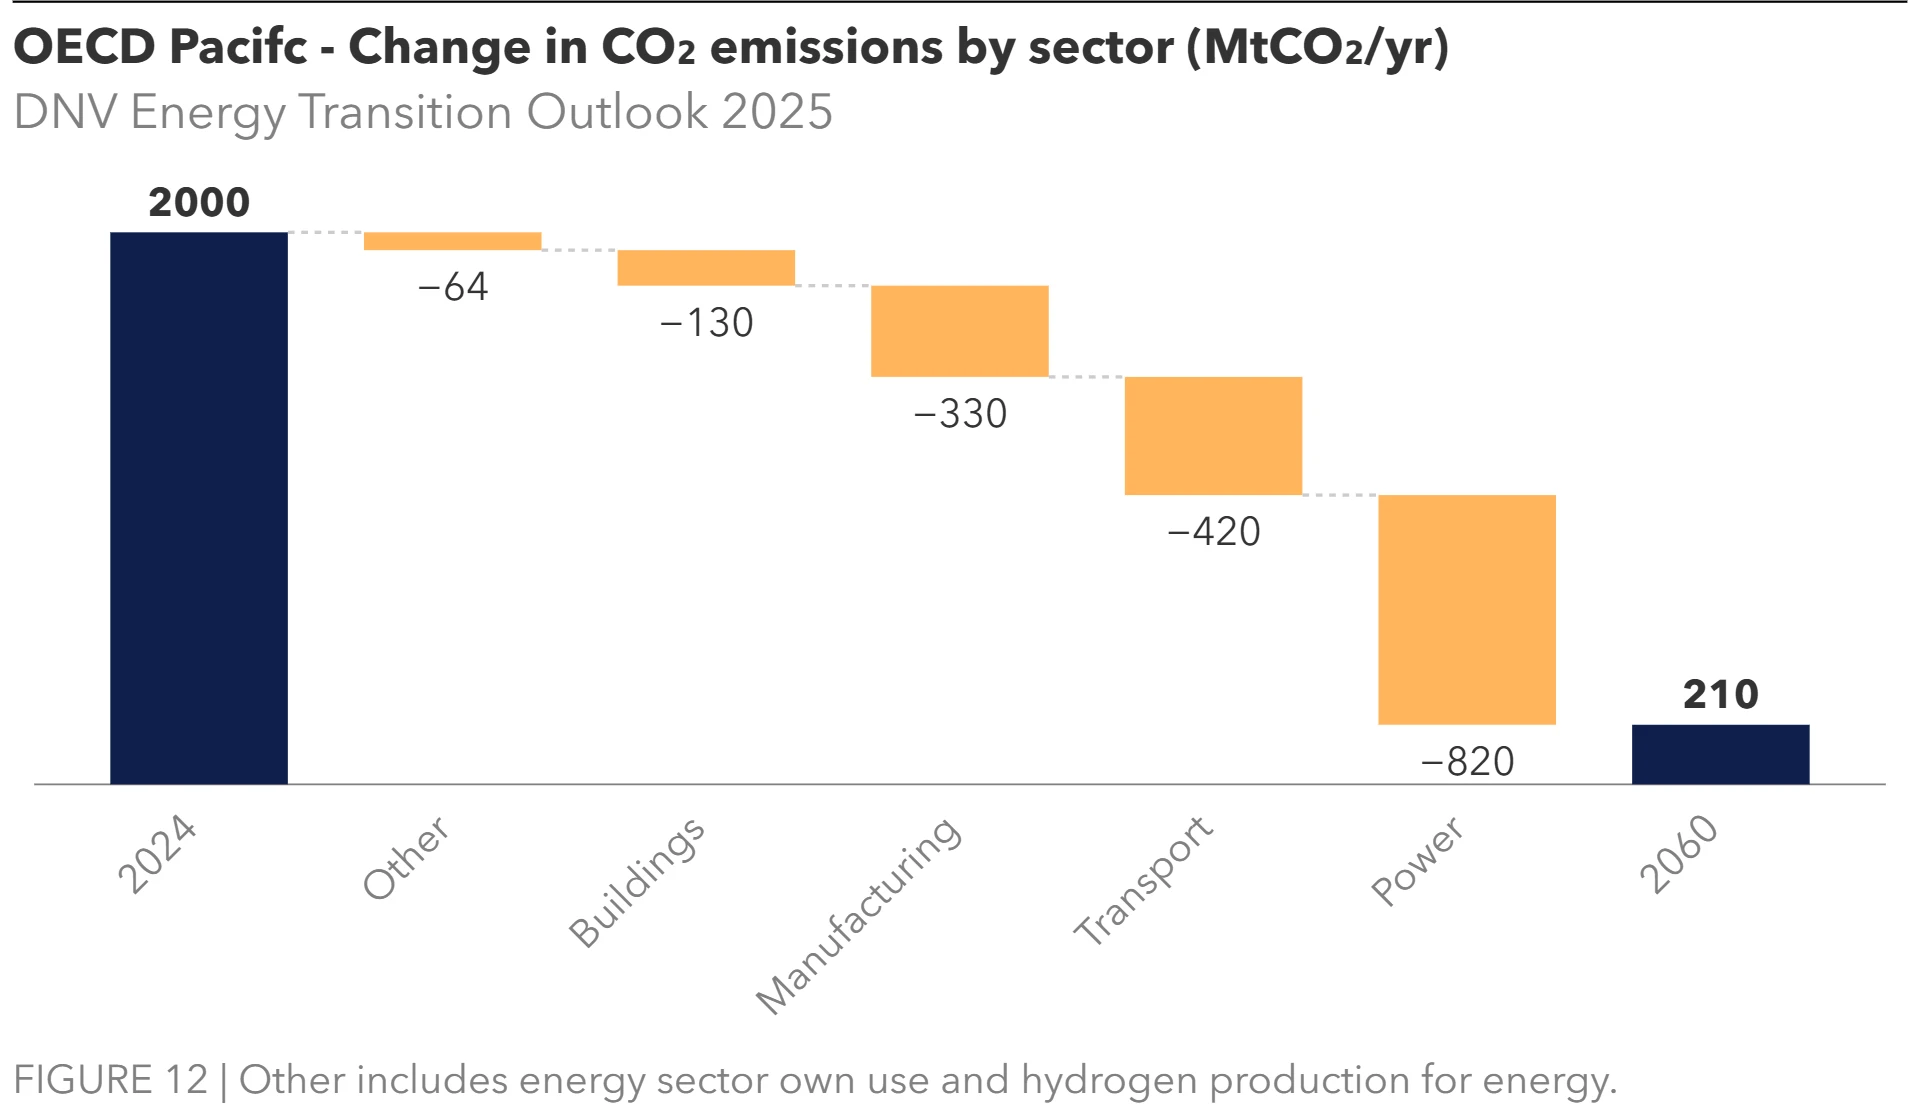
CO2 emissions by sector (GtCO2/yr)
Emissions in OECD Pacific are projected to decline by nearly 90% by 2060. The power sector drives most of this reduction, primarily through phasing out of coal and uptake of renewables. Transport emissions are expected to fall by 87%, and manufacturing by 86%. Despite these reductions, transport and manufacturing will remain key contributors, accounting for 31% and 55%, respectively, of total emissions in 2060.
Electrification accelerates as demographics shift
OECD Pacific is a highly industrialized region with a very high standard of living and GDP per capita. The region is geographically disconnected as none of the countries in this region share common borders or connected power grids. Electricity demand will rise despite a declining population, as fossil fuel dependency wanes in a shift towards renewable energy and increased share of nuclear power.
Population declines while energy demand grows
OECD Pacific is the smallest of our 10 regions, with only 3% of the world population. The region will see a significant drop in population towards 2060, most notably in Japan and South Korea where the population is becoming increasingly elderly as the working-age population shrinks. While there are concerns about a shrinking workforce and an increasing demand for social services including healthcare and pensions, there is also the opportunity for further innovation and automation in industrial sectors such as transport, agriculture, and construction.
Electricity demand rising
Though tempered by population decline and increasing energy efficiencies, annual electricity demand in the OECD Pacific will rise from nearly 3 PWh today to 4.2 PWh in 2060. Electrification will be especially apparent in road transport, which still has low proliferation of electric vehicles (EVs). Uptake of heat pumps, a growing data centre market, and some electrification in manufacturing contribute to increased demand. Around 60% of electricity generation today comes from fossil fuels Renewable sources are expected to grow quickly and will overtake fossil’s share by 2030, while nuclear’s share will grow steadily to 2060.
Fossil’s role slowly declining
Fossil fuels still play a large role in OECD Pacific’s electricity mix. Japan, South Korea, and Australia are heavily reliant on fossil fuels for electricity: today, the share of coal in electricity is 28% and the share of gas 29%. However, concerns over energy security and the drive for a sustainable transition are prompting a shift toward electricity generation that is less reliant on fossil fuels. We expect coal’s share in electricity generation to fall to less than 1% by the early 2040s. The share of gas will only fall to below 1% in the late 2050s, due to its role as a transitional fuel.
While OECD Pacific is shifting away from fossil fuel and transitions to more sustainable energy sources, the region has historically been, and is still today, heavily reliant on the trade of fossil fuel. Japan and South Korea remain heavily dependent on fossil fuel imports, which make up 84% and 79% of their energy supply, respectively (IEA, 2024a,b). Australia, on the other hand, is a major fossil fuel producer and exporter, particularly of coal and LNG, much of which is consumed by Japan and South Korea. Despite this, the region is undergoing a significant energy transition. The share of fossil fuels in the region’s primary energy supply is expected to decrease from 84% to just 18% by 2060, marking a major transition towards more renewable fuels.
Slow EV adoption is prolonging oil demand
More than half of the total demand for oil is from transport, due mainly to a largely unelectrified road transport fleet. Today’s road transport energy demand is 95% oil, and we forecast this share will reduce to 80% by 2040 and accelerate down to 11% by 2060.
EV uptake is slow in Japan, as EVs struggle to compete with the existing market for hybrid vehicles. Despite low levels of EV uptake today, Japan targets all new passenger vehicles to be electrified by 2035 and has plans to build out EV infrastructure, which is currently sparse. Australia and New Zealand have higher shares of EVs in their fleets than Japan but still face similar challenges with expanding their charging infrastructure and consumer preferences for internal combustion engines or hybrids. South Korea has the highest share of EVs in the region, supported by strong domestic automative production and ongoing policy support for charging infrastructure.
Solar will outshine other renewables
Installed solar capacity will grow rapidly in OECD Pacific, from 265 GW today to nearly 1,370 GW in 2060. While grid-connected solar accounts for most of the solar installed today, we expect distributed solar (behind-the-meter, BTM; and off-grid) to overtake it by the mid-2030s. Currently, most of the capacity is installed in Japan and Australia. Solar is leading Japan’s renewables expansion, buoyed by feed-in-tariffs, but utility-scale solar installations often face challenges with limited land availability. Conversely, Australia has large land mass and very high solar potential, which contributes to solar’s rapid growth.
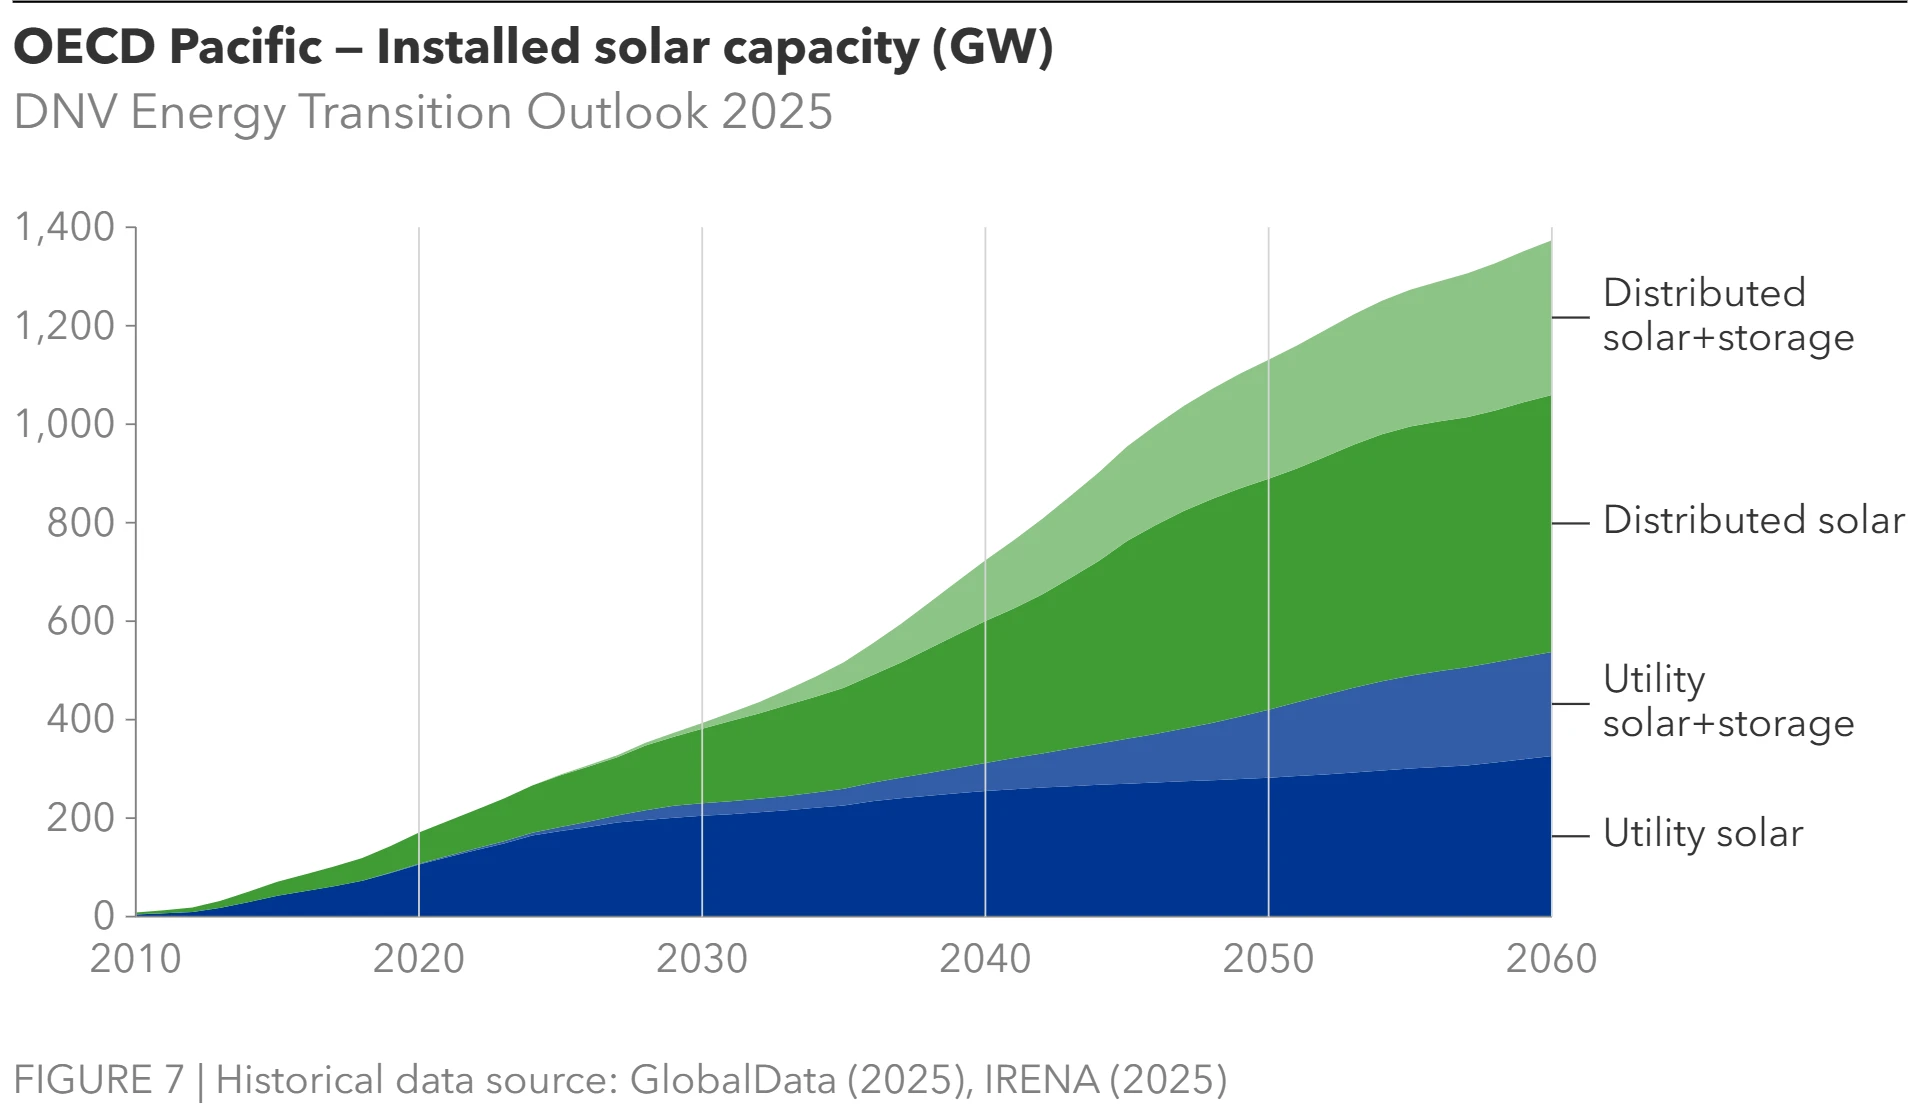
Rooftop (BTM) solar uptake in Australia is the highest in the world, thanks to long-term government support in the form of subsidies, favourable sunny conditions, and high proliferation of stand-alone homes in urban areas which provide more rooftop space for BTM installations. Rooftop solar contributed over 12% of Australia’s electricity and is installed on around one in three Australian homes (Clean Energy Council, 2025).
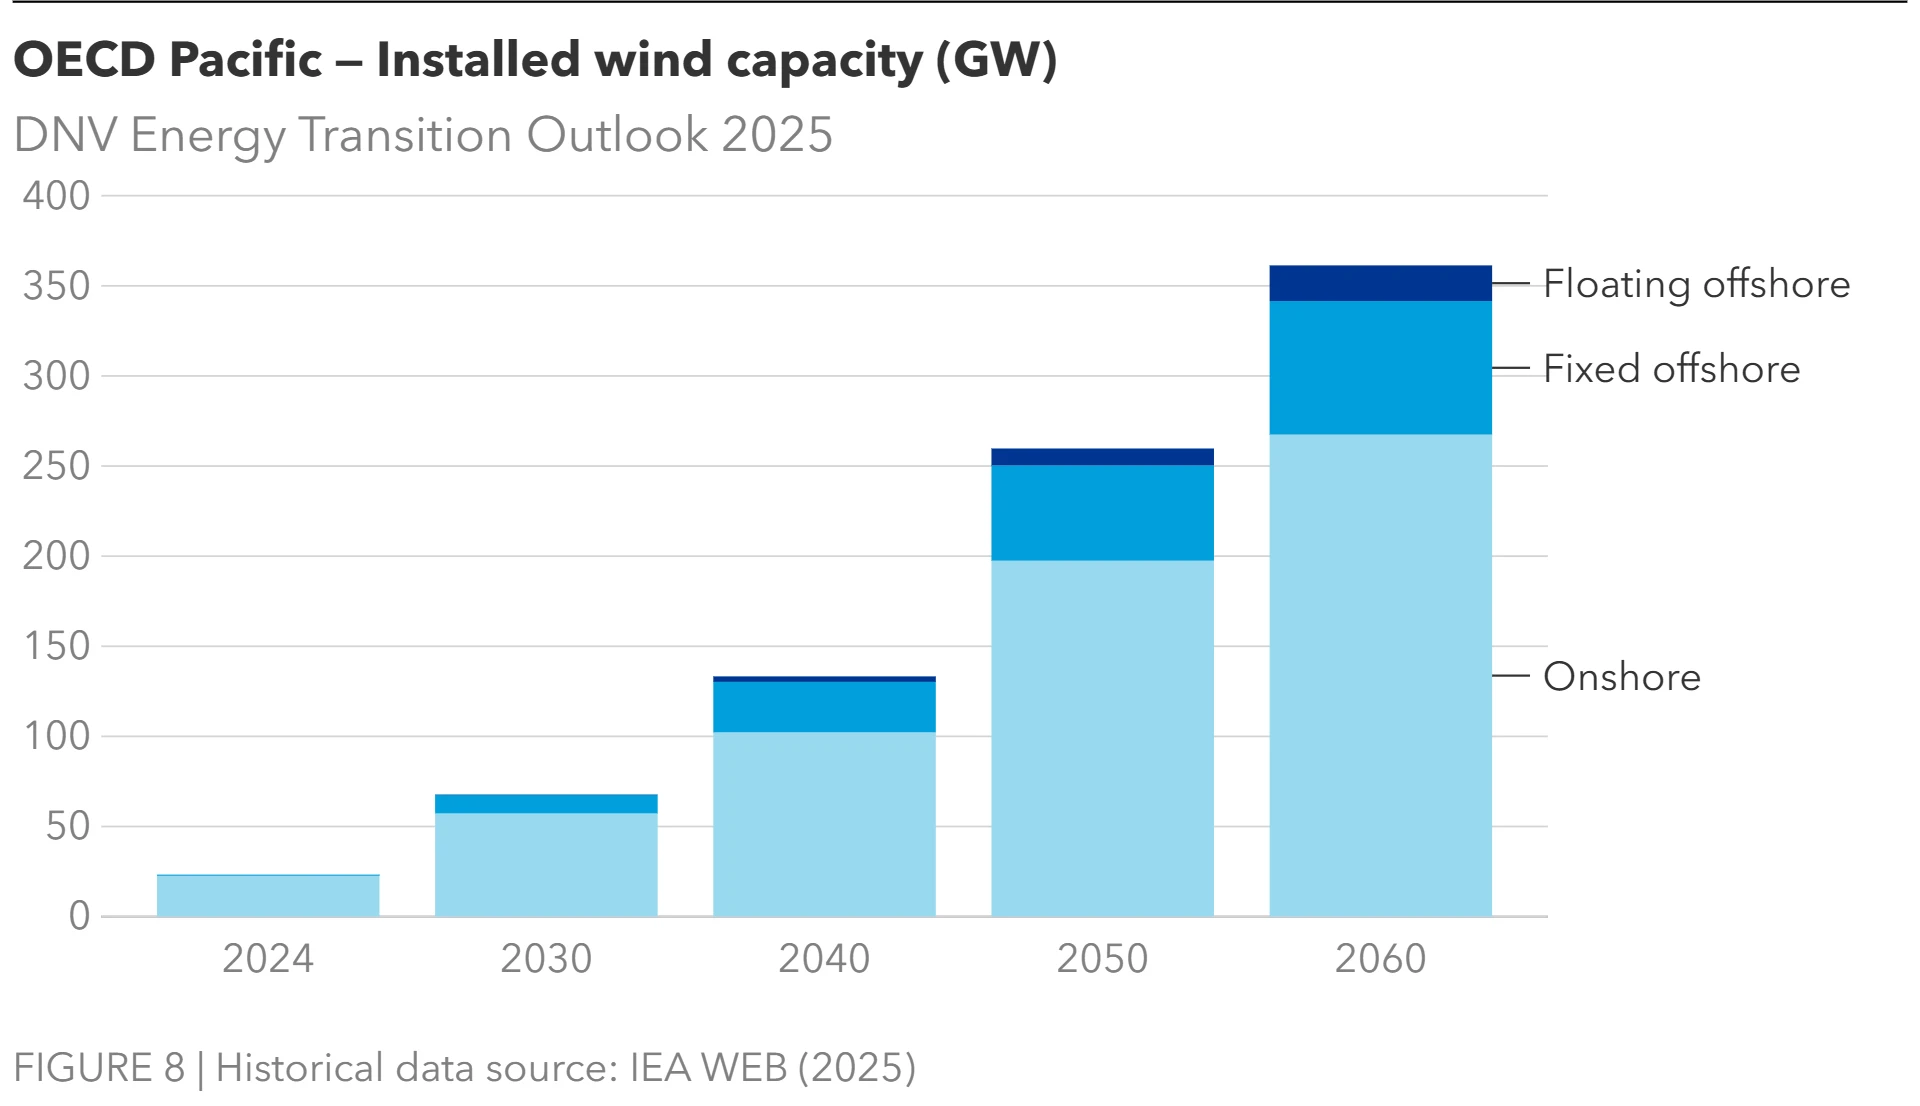
Wind targets offshore expansion
Wind is set to grow considerably, primarily onshore in the coming decade with growing offshore wind in the 2030s. Installed wind capacity is set to more than double from 23 GW today to 53 GW by 2028 and will continue to double on average every 9.5 years. Total installed capacity will reach 260 GW by 2060, and although it will still be dominated by onshore wind, the share of onshore will fall from 97% today to 74% in 2060.
However, wind still faces some community opposition, especially in Australia and New Zealand, with concerns revolving around proximity to homes and perceived detrimental effects on human health and the local environment. Offshore wind faces similar opposition but to a lesser extent, with concerns mainly around impacts on views from the mainland, local fishing industries, and marine wildlife.
Offshore wind development is gaining momentum in the region. South Korea has expanded auction zones and launched power purchase agreements (PPAs) with an 18 GW target for 2030. To support its growing offshore wind industry, Japan has revised its auction rules to boost local content requirements, is pushing through with regulatory reforms, and is investing in port infrastructure. There are over 80 offshore wind projects planned in Australia, but none are currently operating. Australia has declared 6 priority offshore wind zones and 12 feasibility licenses, with the most advanced project, Star of the South, expected to come online in 2030. New Zealand has launched feasibility studies to determine the benefits and impacts associated with establishing an offshore wind industry.
Grid build-out and modernization
As renewable energy grows rapidly in OECD Pacific, grid flexibility has become a top priority – driving efforts to modernize grid infrastructure and accelerating the deployment of battery energy storage systems (BESS).
A major barrier across the region is transmission bottlenecks. In Australia, the Australian Energy Market Operator (AEMO) has warned that delays in grid expansion could lead to significant solar curtailment by 2027, especially in southeastern regions (AEMO, 2025). Although South Korea faces similar challenges, one of the most significant barriers is local opposition, delaying major grid construction projects by up to 11 years (IEEFA, 2025). Additionally, Korea Electric Power Corporation’s (KEPCO) financial constraints and grid monopoly further hinder efficient grid expansion and modernization. Japan’s fragmented grid and limited interconnection capacity exacerbate curtailment risks, especially in the northern region of Tohoku and Kyushu in the south.
In response, BESS is emerging rapidly in the region as a solution to enhance power-system stability and manage the variability of increasing renewable energy. Australia leads with over 10 GWh in the pipeline, driven by government support policies such as the Capacity Investment Scheme, increasing profitability due to higher price volatility and changing market dynamics. South Korea has revived its storage market after a post-2020 incentive hiatus, with the Korea Power Exchange (KPX) planning annual procurements of 500 MW (3,000 GWh) through 2029. The country is also exploring hybrid systems combining BESS with hydrogen in industrial zones. In Japan, BESS uptake is driven by solar curtailment subsidies. In New Zealand, the construction of the country’s first large-scale grid battery was completed this year, with a maximum capacity output of 100 MW of electricity and a storage capacity of 200 MWh (Meridian Energy, 2025).
Nuclear remains part of diversified energy mix
The OECD Pacific region presents a mixed landscape for nuclear energy. While Japan and South Korea are actively expanding their nuclear capacity, nuclear power remains absent in Australia and New Zealand. Although there are discussions on nuclear energy in Australia, strong political and public resistance persist. No developments in Australia and New Zealand are expected through 2060.
South Korea currently has 26 operational reactors with over 25 GW capacity, and aims to build four more, (IAEA, 2025a) including two units totaling 2.8 GW expected in 2026 (Varadhan et al., 2025). In 2024, nuclear energy made up 32% of electricity production (IAEA, 2025a), racing ahead of official targets thanks to fewer power outages, a new plant, and reactors running at full capacity – cutting costs and coal use. In the long term, South Korea aims to raise nuclear power’s share of electricity to 35.2% by 2038, as outlined in the 11th Basic Plan – meaning an additional 3.5 GW of nuclear capacity will be needed (Enerdata, 2025). Following a recent shift in political leadership, South Korea’s new president has introduced a more cautious stance towards nuclear energy, expressing concerns regarding nuclear safety and waste management. While he supports extending the lifespan of existing reactors, he opposes new builds and plans to revise the regulatory framework to promote a more diversified energy mix.
Since the 2011 Fukushima disaster, Japan has restarted 14 reactors, totaling approximately 12 GW capacity, with two additional units under construction (IAEA, 2025b). This marks a significant shift from the pre-Fukushima era, when 54 reactors supplied 30% of the country’s electricity (eia, 2015). In 2023, nuclear power accounted for 8.5% of grid supply. However, as outlined in the government’s 7th Strategic Energy Plan, this is set to more than double to 20% by 2040 through reactor restarts and life extensions of existing reactors (now allowed to operate beyond 60 years) (METI, 2025b). This would allow the country, which relies heavily on fuel imports, to cut back on carbon emissions and become more self-reliant. Reaching the government’s goal would require reactivating 33 reactors, though safety inspections, local opposition, and aging reactors remain key challenges.
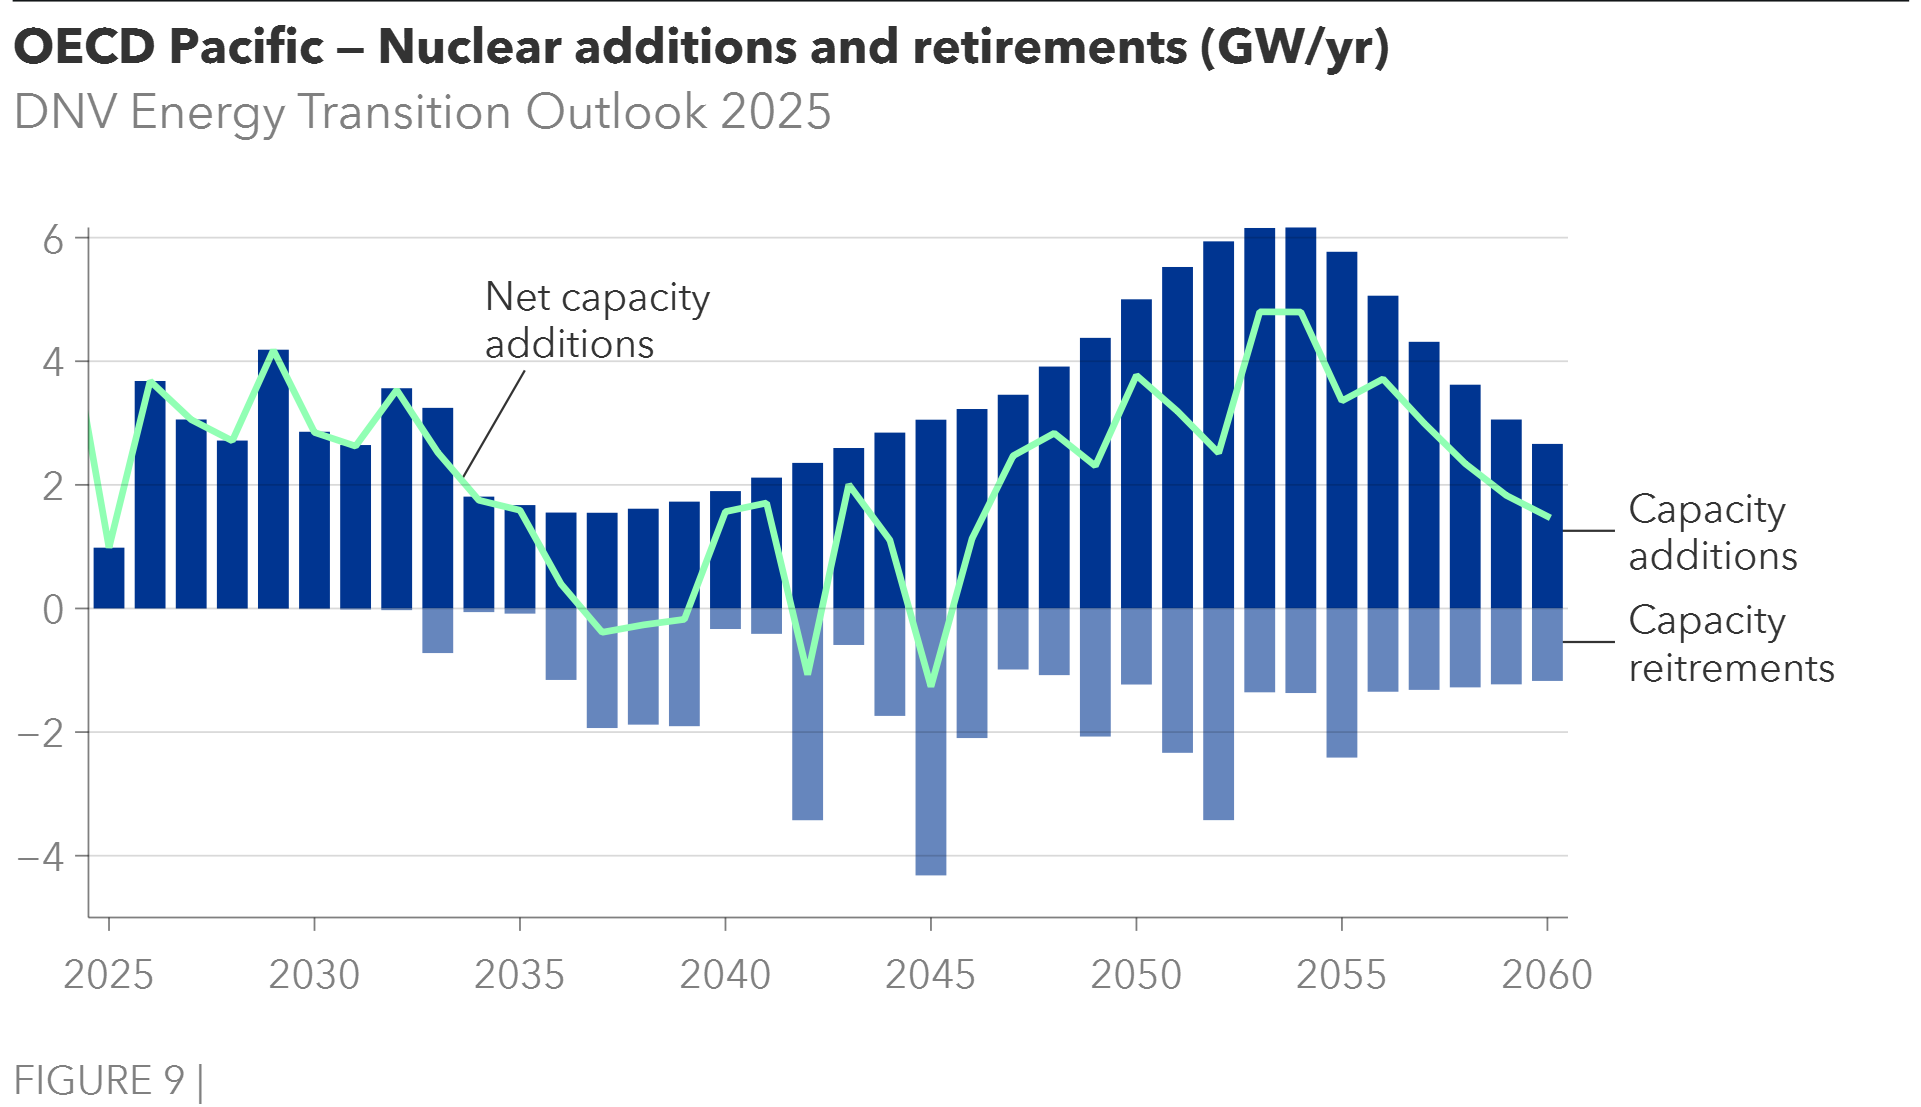
As of 2024, nuclear energy accounted for approximately 13% of the OECD Pacific region’s electricity mix, and is projected to reach 28% by 2060, making it the region in our forecast with the highest nuclear share. This growth is driven by energy security concerns, limited land for renewables, and the need to decarbonize power systems to meet emission targets. Up to 30 GW of new capacity is expected over the next decade, with capacity additions peaking mid-century (Figure 9). Small modular teactors (SMRs) are expected to enter the mix post-2040, particularly in South Korea, though their contribution will remain modest until mid-century. By 2050, SMRs are projected to account for 60% of new capacity additions.
Pragmatic hydrogen development
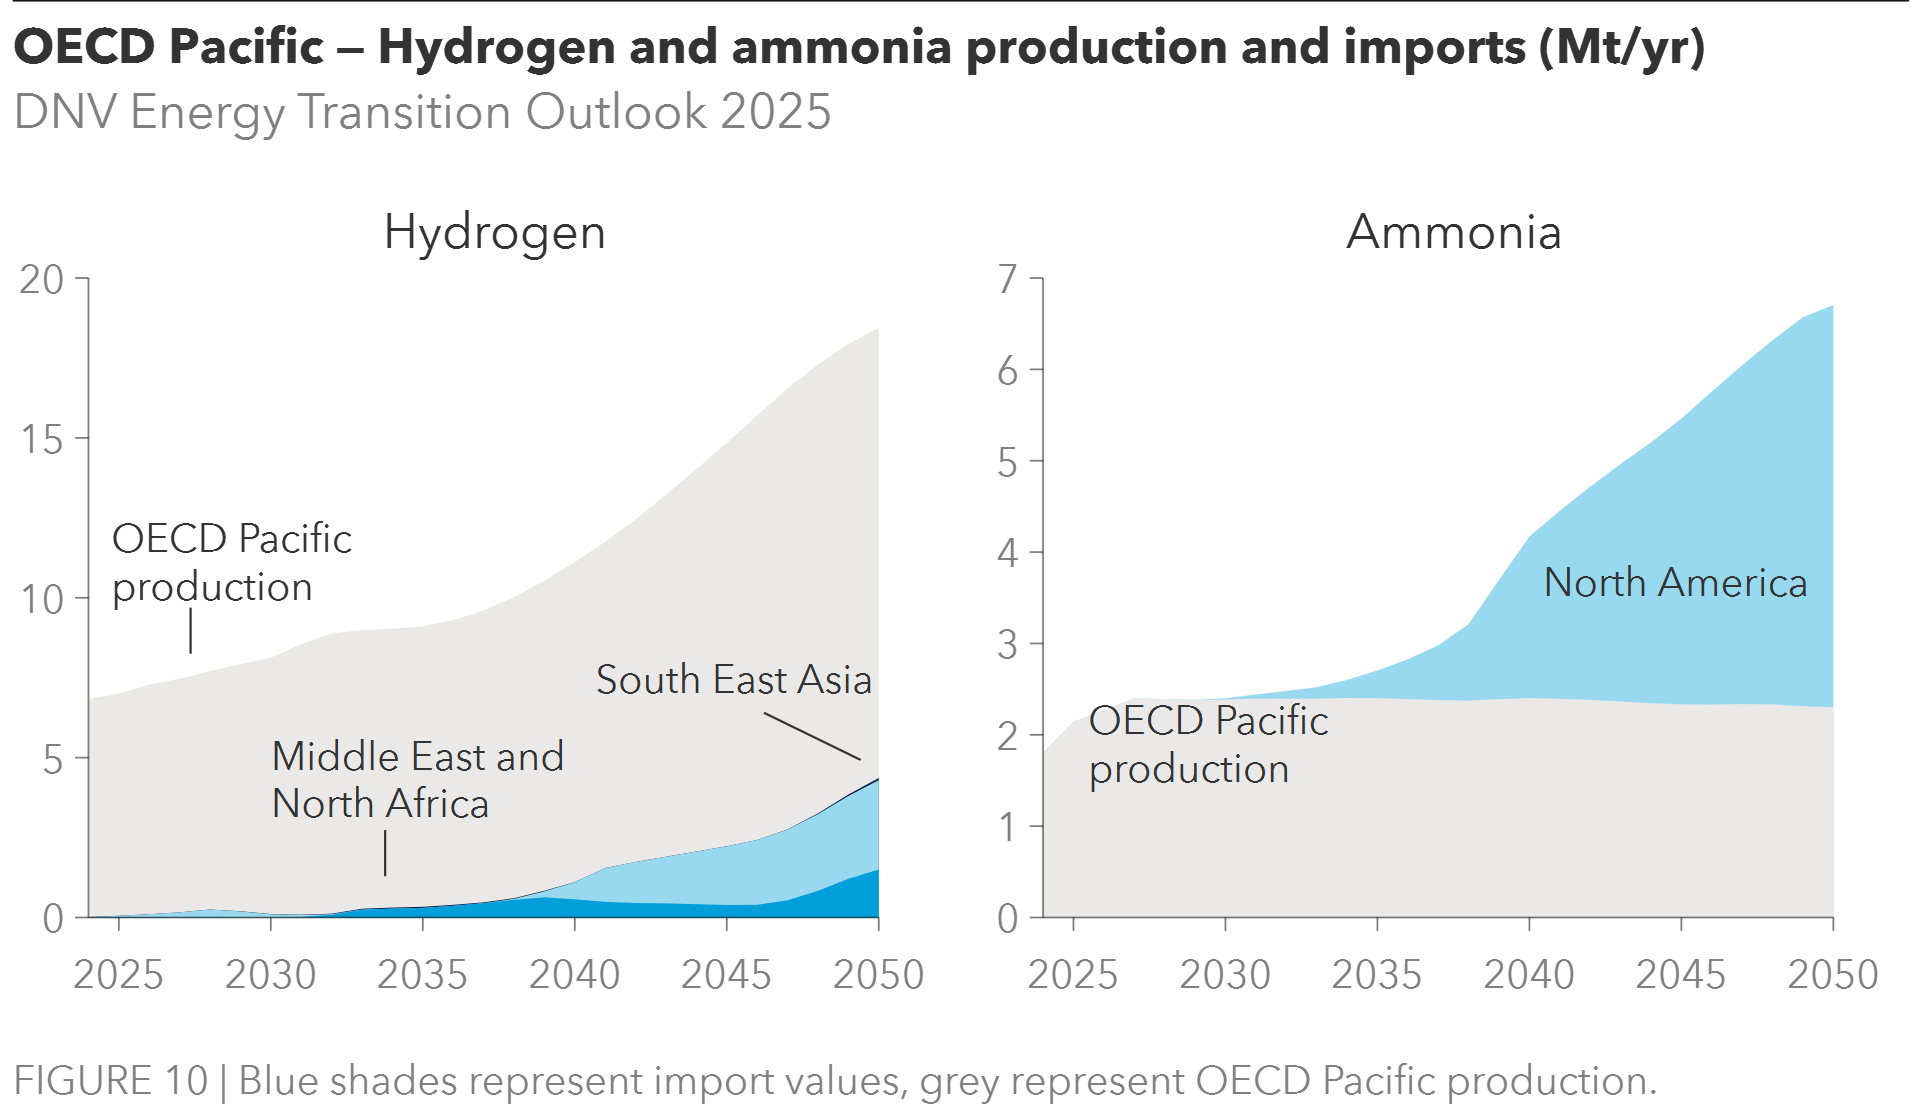
Hydrogen development in the OECD Pacific is entering a more pragmatic phase marked by diverging national strategies. Australia is shifting away from ambitious export plans towards domestic industrial applications, emerging as a higher priority. The focus is shifting to green iron production, decarbonizing existing industries, and producing green ammonia and methanol for shipping. In contrast, Japan and South Korea are pursuing diversified import strategies, sourcing hydrogen and derivatives from the Middle East, Latin America, and North America.
Looking ahead, hydrogen demand in the region is expected to more than double from under 7 Mt in 2024 to over 18 Mt in 2050, with Japan and South Korea as the primary consumers. Today, hydrogen’s role in the region is primarily in refineries. By 2050, hydrogen is projected to represent around 7% of final energy demand in the region, with manufacturing (46%), synthetic fuels (14%), and refining (15%) as the largest consumers.
Driven by accelerating policy momentum, hydrogen production in OECD Pacific is expected to nearly triple from 7 Mt in 2024 to 19 Mt by 2060. Although green hydrogen has stalled in Australia, the country has set an ambitious goal of producing 15 Mt of hydrogen annually by 2050, with a stretch potential of 30 Mt (Australian Government, 2024). To support this, the government has introduced the USD 22.7bn Future Made in Australia plan, including a USD 2/kg hydrogen production tax incentive and the Hydrogen Headstart Program (USD 4bn committed) (Australian Government, 2024). South Korea has also set a robust goal to produce 27.9 Mt of hydrogen annually by 2050 (GH2, 2024). The country also launched the world's first clean hydrogen power bidding market for supplying and buying electricity produced by harnessing clean hydrogen. Japan is advancing through the Hydrogen Society Promotion Act and the USD 132 billion (JPY 20trn) GX initiative (METI, 2024), while the Japan Hydrogen Fund launched with USD 400m in commitments aims to build a low-carbon hydrogen value chain (Segal, 2024).
Carbon markets
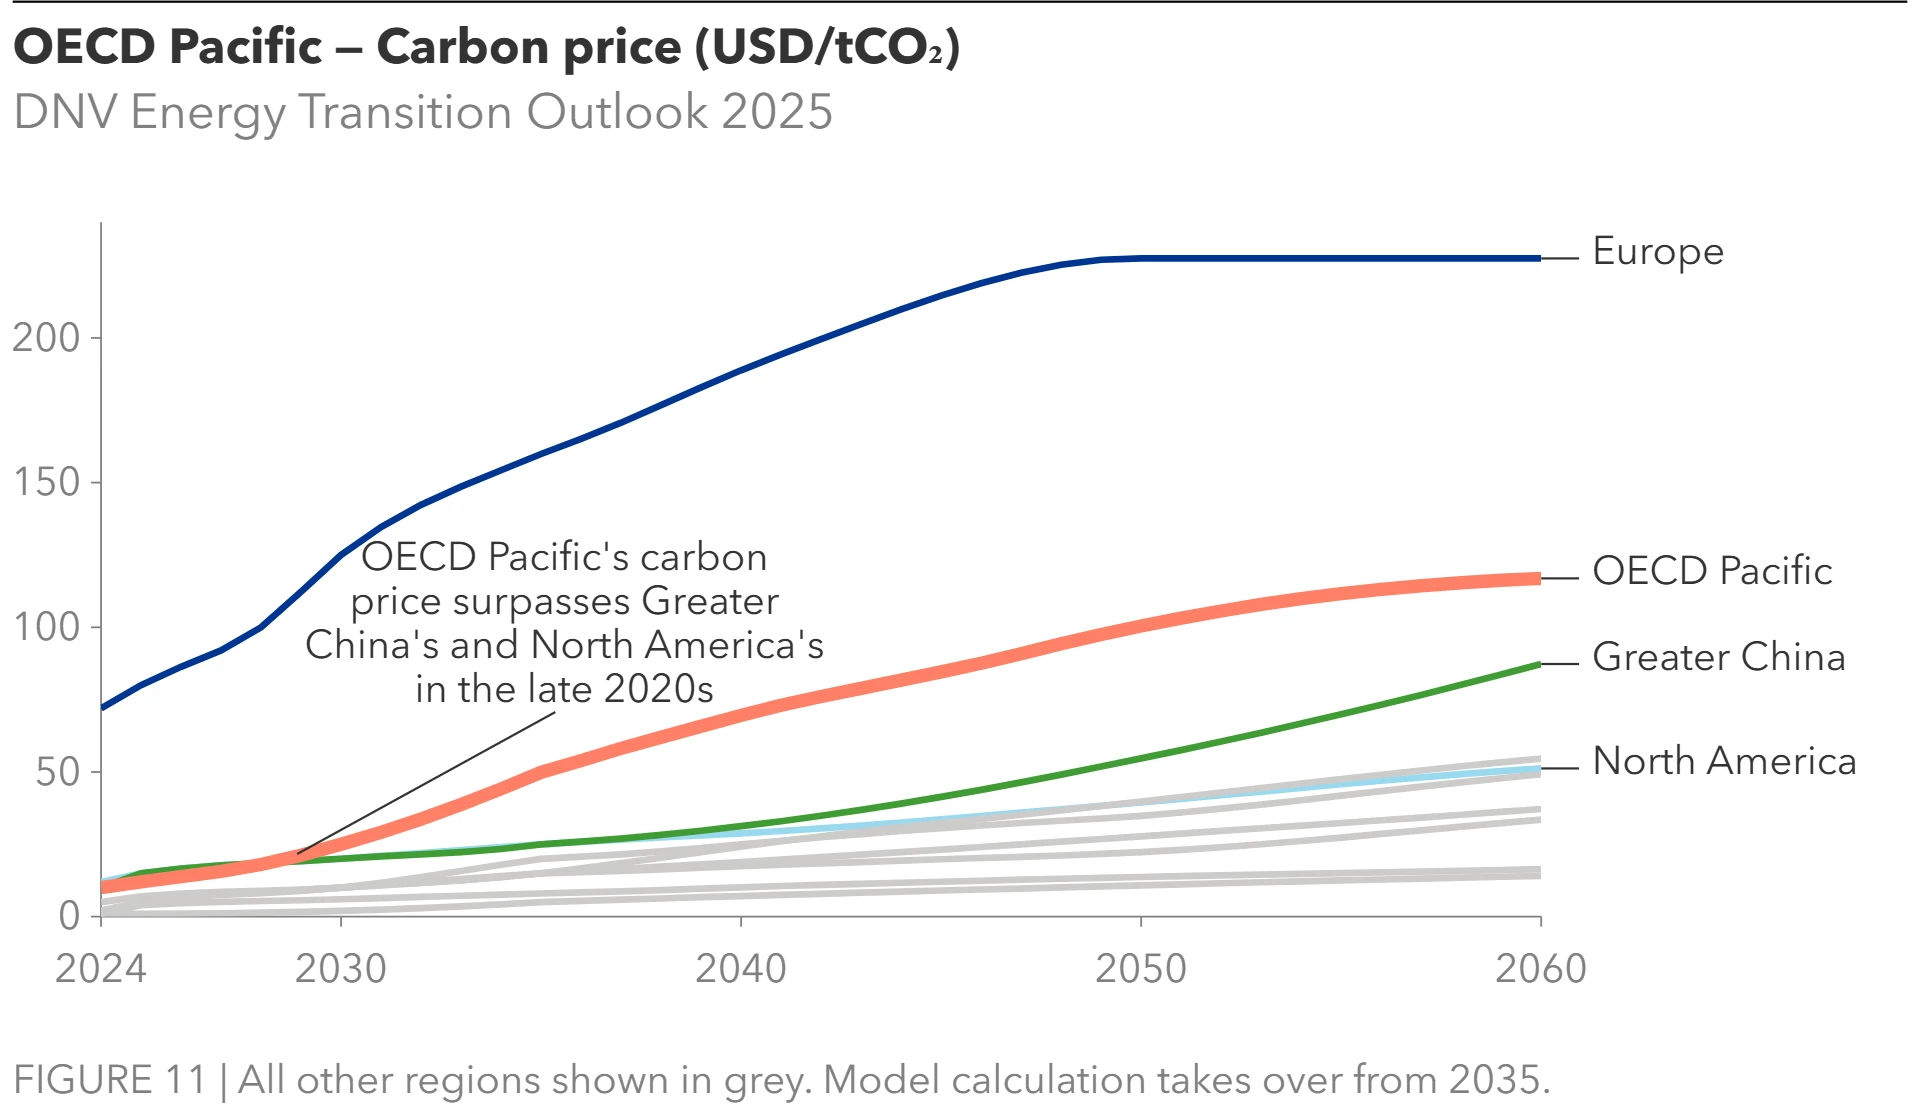
Carbon pricing mechanisms are in place in all four countries in the OECD Pacific region. However, the impact is currently limited, and the price remains low. Factors limiting the mechanisms’ effectiveness include carbon pricing only being applied to a limited share of emissions (Japan), generous free allowances which cover significant shares of emissions (South Korea, Japan), and high emissions benchmarks which very few installations exceed, meaning most are exempt from paying the carbon price (Australia). Despite low carbon prices today, we expect that policy evolutions in the mid- to long-term will raise the carbon price. The regional average carbon price is projected to reach USD 25/tCO2 in 2030 and grow to almost USD 120/tCO2 in 2060. This will be the second highest carbon price, behind Europe, among our Outlook regions.
In Japan, the National GX League pilot has transformed into a voluntary baseline-and-credit system (GX-ETS) with over 700 companies participating. The carbon price is currently only applied to a limited share of emissions, but there are plans for mandatory GX-ETS participation from 2026. South Korea released its 4th Basic Plan for its ETS in December 2024, which outlined mid- to long-term policy goals and fundamental direction for the ETS until the end of 2035. Australia reformed its Safeguard Mechanism in 2023, which assigns mandatory emissions baselines for large facilities, with baselines to reduce 4.9% per year to 2030. The first Safeguard Mechanism Credits were issued in February 2025. New Zealand has broad sectoral ETS coverage, with the cap trajectory aligned with national 2050 net-zero targets.
Climate and emissions
OECD Pacific, a region characterized by diverse ecosystems and climates, is experiencing increasingly frequent and severe climate-related events – such as wildfires in Australia, typhoon-driven rains in Japan, and floods in New Zealand – resulting in economic losses in the billions of dollars.
Emissions per capita remain high, particularly in Australia and South Korea, due to fossil-fuel dependency and industrial activity. Japan and South Korea have made progress in reducing emissions since 2020, but challenges persist in decarbonizing heavy industry and transportation. New Zealand, benefitting from its relatively clean electricity grid, struggles with high agricultural methane emissions from its dominant farming sector. Australia is transitioning from coal domestically, but the country’s role as a major fossil-fuel exporter creates inherent contradictions in its climate policy framework.
Climate risk management is advancing across the region, moving beyond traditional corporate reporting to implement asset-level assessments. Japan’s Financial Services Agency (FSA) has introduced guidelines requiring financial institutions to evaluate and disclose climate-related risks, with a particular focus on natural catastrophe exposures in energy portfolios. In the industrial sector, original equipment manufacturers face rising environmental and social demands. While carbon disclosure in project financing remains voluntary, competitive pressure is driving greater environmental, social, and governance (ESG) transparency.
In the context of global climate policy, all four countries in OECD Pacific have committed to net-zero emissions by 2050. Assessment of country pledges in nationally determined contributions (NDCs) suggests an average regional target of reducing GHG emissions by 10% by 2030, relative to 1990 levels. We forecast energy- and process-related CO2 emissions – after CCS and direct air capture (DAC) – to decrease 9% by 2030, indicating that the region will almost meet this ambition level. Looking ahead, declining primary energy use, combined with declining population, will lead to emissions falling continuously through the forecast period. By 2060, emissions are forecast to decline by 89% from 2024 levels, driven by reduction in coal use and increased adoption of renewables.
For the region as a whole, energy- and process-related CO2 emissions are expected to be 0.5 GtCO2/yr (net of CCS and DAC) in 2050, 70% below 2024 levels, but still not meeting the long-term targets.
Policy summary
A non-exhaustive list of sector policy initiatives, emphasizing the 2024 to 2025 period
|
Climate emission targets Australia, Japan, New Zealand, South Korea have net-zero ambitions by 2050. |
||
|
Sector |
Policy details and example initiatives |
Mechanism(s) |
|
Power |
> Competitive bidding processes are prevalent to reach renewable (RE) targets: Australia for 82% of generation by 2030, New Zealand for 100% by 2035. Japan for 36-38% by 2030, South Korea for 22% by 2038 and 122 GW capacity 2038. South Korea has a renewable portfolio standard on utilities. > Offshore wind plans include Japan for 10 GW by 2030 and 30-45 GW by 2040 with indication of increasing support levels after Mitsubishi’s withdrawal from three major projects, and auctions to allocate sites and secure 20-year PPAs. South Korea’s Special Act on the Promotion of Wind Power (February 2025) adopts a planned site approach led by government with a goal for 20 GW by 2030. |
Tenders/auctions
Mandates |
|
> Clean hydrogen power is promoted in Japan and South Korea. Capacity auctions source ammonia and hydrogen for co-firing. Japan has a CfD scheme, compensating producers for the cost gap between hydrogen-generated power and the market price of electricity. South Korea has long-term PPAs for 3,000 GWh/year (for 2028 operation) and its clean hydrogen portfolio standard mandates power producers to incorporate clean hydrogen into their energy mixes. |
Tenders/auctions
Mandates |
|
|
> Nuclear power expansion is pursued to increase decarbonized power sources as part of Japan’s GX policy, aiming for 20-22% of electricity by 2030. South Korea aims for 35% of electricity by 2038. |
Public budget Regulated revenue |
|
|
> Energy storage has an expanding role in policy frameworks to ensure grid reliability. Storage systems participate in energy markets, creating revenue opportunities in response to supply-demand signals. > Support schemes include Australia’s Capacity Investment Scheme (2024-2027) for 9-14 GW dispatchable capacity, in addition to 23 to 26 GW renewables by 2030 and the Cheaper Home Batteries Program, rollout in 2025, offering a 30% rebate, and subsidies in Japan (between one and two-thirds of capital costs) in METI’s programme supporting grid-scale BESS projects. |
Market design Tenders/auctions Government funding
|
|
|
Grids |
Grid flexibility tops policy agendas with pursuit of grid upgrades, grid expansion and smart grids, such as South Korea championing the Energy Highway initiative and the Special law for the expansion of the national power grid with streamlined permitting processes and compensatory schemes. |
Plan |
|
Hydrogen |
> Hydrogen/derivatives are key to transition plans with comprehensive support to commercialization. > Japan and Korea promote the entire value-chain with funding, CfD schemes with emission intensity-based support. Japan targets 3 Mt/yr hydrogen and 3 Mt/yr ammonia by 2030, and 20 Mt/yr hydrogen, 30 Mt/yr ammonia by 2050 in volume targets from domestic production and overseas imports. South Korea aims to supply 27.9 Mt/yr by 2050, entirely from clean sources, with over 80% imported. > Australia’s 2024 National Hydrogen Strategy emphasizes production, aiming for 15–30 Mt annually by 2050. It is backed by the Future Made in Australia plan, the Hydrogen Production Tax Incentive, and the expanded Hydrogen Headstart Program as the basis for government support through 2040. |
Targets Government funding, R&D, pilots Tenders/auctions Production incentive
|
|
CCS/DAC |
Comprehensive policy frameworks and funding programmes advance CCS in the region. See DNVs Energy Transition Outlook: CCS to 2050 for further details. |
Targets Government funding Carbon pricing |
|
Transport |
> Clean energy vehicle uptake (EVs, FCEVs) is supported through incentives and investment in charging/refuelling infrastructure, and in Japan and Korea supporting vehicle development. South Korea announced USD 515m (721.8bn won) to FCEV purchases (passenger/commercial) in 2025. > In aviation, South Korea SAF Blending Mandate Roadmap for 2027-2035 sets 1% for 2027, increasing to 7-10% by 2035, adopting non-compliance penalties (September 2025), also with support to SAF plant CAPEX and feedstock procurement. Japan’s binding mandate is 10% SAF by 2030 and the GX policy provides 10-year tax credits to fuel production. Australia supports SAF production through Future Made in Australia funding. |
Purchase incentives Government funding, R&D, pilots Mandates, penalties Carbon pricing |
|
Manufacturing |
> Clean hydrogen use and CCS in hard-to-decarbonize sectors have multipronged policies. Financial support intends to cover the price gap between clean and conventional fuel with CfDs (15-years) with emission intensity-based support. Japan requires 70% offtake agreements for CfD eligibility. Korea provides soft loans to large-scale projects in carbon-neutral technologies. There is support to capital expenditures, such as Australia’s Safeguard Transformation Stream for up to 50%. |
Government funding Tenders/auctions
|
|
Buildings |
> Enforcement of gradually stricter energy-efficiency building codes and standards with subsidies to improvements/retrofits. Heat pumps are promoted with financial incentives as part of reducing fossil-fuel heating. South Korea bans installation of new gas boilers starting 2025. > Japan’s Hydrogen Society Promotion Act (October 2024) signal the ambition of widespread adoption. Korea’s National Smart City Project involve pilot cities deploying new technologies including residential fuel cells, hydrogen-powered buses and cars. |
Standards Incentives Ban
Government funding, pilots |
References
AEMO (2025). 2025 Enhanced Location Information (ELI) Report. July.
Australian Government (2025a). Electricity and Energy Sector Plan. 17 September.
Australian Government (2025b). Carbon Management for Tough Emissions. 11 July.
Australian Government (2024). National Hydrogen Strategy 2024.
CCA – Climate Change Authority (2025). Home safe: National leadership in adapting to a changing climate. 19 June.
Clean Energy Council (2025). Rooftop solar and storage biannual report. 17 March.
eia (2015). Japan restarts first nuclear reactor under new safety rules. 12 August.
Enerdata (2025). South Korea unveils new nuclear and renewable capacity development plan to 2038. 24 February.
GEM – Global Energy Monitor (2025). Global Nuclear Power Tracker. Accessed September 2025.
GH2 India (2025). India and Japan Chart a Clean Hydrogen Future. August.
GH2 (2024). South Korea.
IAEA (2025a). Korea, Republic of – Country Highlight.
IAEA (2025b). Japan – Country Highlight.
IEA (2024a). Japan – Energy mix.
IEA (2024b). Korea – Energy mix.
IEEFA (2025a). Bottlenecks to renewable energy integration in South Korea. 5 June.
METI (2025a). The GX2040 Vision Revised Strategy for Promoting the Transition of a Decarbonized Growth-oriented Economic Structure was approved by the Cabinet. 18 February.
METI (2025b). Cabinet Decision on the Seventh Strategic Energy Plan. 18 February.
METI (2024). Hydrogen Society Promotion Act Enacted Toward a Forthcoming Hydrogen-based Society Part 2: Utilization of Clean Hydrogen. 10 September.
Meridian Energy (2025). Completion of Ruakākā Battery Energy Storage System. 23 May.
New Zealand Government (2024). Second emissions reduction plan released. 11 December.
Oxera (2024). The economic cost of extreme weather events. Prepared for the International Chamber of Commerce. 7 November.
Segal, M (2024). New $400 Million Japan Low Carbon Hydrogen Development Fund Backed by Toyota, SMBC, TotalEnergies, Others. ESG today. 16 September.
Varadhan, S., Lee, J., Yang, H. (2025). South Korea's nuclear power output surges as coal use plunges. Reuters, 18 August.