Energy Transition Outlook 2025
This region stretches from Morocco to Iran, including Turkey and the Arabian Peninsula.
| 2024 | 2060 | |
| Population | 585 million | 811 million |
| GDP* | USD 13.6 trillion | USD 32.5 trillion |
| GDP/person | USD 23 000 | USD 40 000 |
| Primary energy use | 58 EJ | 81 EJ |
| Primary energy use/person | 100 GJ | 100 GJ |
| CO2 emissions** | 3.2 Gt | 2.2 Gt |
| CO2 emissions/person | 5.5 tonnes | 2.7 tonnes |
*All GDP figures in the report are based on 2017 purchasing power parity and in 2023 international USD.
**Energy- and process-related CO2 emissions, after CCS and DAC.
The Middle East and North Africa (MEA) region possesses immense energy wealth, with vast hydrocarbon reserves and renewables potential. Countries are seeking to diversify their energy portfolios and leverage clean energy trends – some motivated by energy security and reducing energy trade deficits, others by economic diversification in balance with hydrocarbon investments.
Current situation
96
%
Fossil fuels
in primary energy supply in 2024
20
%
Rise in CO2 emissions
from 2020 to 2024
13
bn/yr
Annual losses (USD)
due to dust storms
- Fossil fuels accounted for 96% of energy supply in 2024 and the renewable energy share is low across the region. Renewables accounted for 12% of the power mix in 2024, with 7% from non-hydro sources.
- Renewable energy development varies widely: Morocco, Egypt, Saudi Arabia, and the United Arab Emirates (UAE) have strong policies and some of the world’s largest renewables projects underway, while other countries have limited policy and/or financial and regulatory constraints.
- Energy-related CO2 emissions are rising – around 20% between 2020 and 2025 – driven by growing populations, GDP per capita, and power demand, the latter increasing 3% annually from 2020 to 2024.
- Climate risks include extreme heat and severe water stress (Kuzma et al., 2023). Dust storms cause USD 13bn in annual economic losses (Arkeh et al., 2024), while the 2024 UAE floods caused more than USD 8bn in damages (Munich Re, 2025). The UAE’s pioneering climate law (May 2025) mandates public and private entities to assess, mitigate, and adapt to climate risks, though implementation details are pending.
Pointers to the future
- Several countries have net-zero emissions targets with a 2050 or 2060 time horizon. The UAE’s new nationally determined contribution (NDC) (November 2024) commits to an economy-wide 45% emissions reduction from 2019 levels by 2035.
- Hydrocarbon producers plan fossil fuel expansion while aiming to decarbonize operations, cut emission intensity, and invest in negative emissions technologies. Countries are leveraging state-owned / national oil companies to finance carbon capture, storage, and utilization projects, in part motivated by the emerging low-carbon hydrogen export market.
- Supply-side policy includes high renewable power penetration targets and support measures, accompanied by increasing focus on energy storage, with Saudi Arabia being a major player. A growing number of solar PV and wind projects are being implemented with large co-located batteries.
- With rising electricity consumption and renewables buildout, continued investment into expanding and upgrading electrical networks is expected. This includes enhancing infrastructure and regulatory alignment to support cross-border electricity and gas trade in the region.
- Decarbonization beyond the power sector is uncertain, given less pronounced sectoral targets and policies. However, there are notable exceptions among state-owned manufacturers in steel or aluminium production, who are investing in solutions to lower the carbon footprint of products. E-mobility is supported in select countries, but broad adoption is hindered by fossil-energy subsidies.
- Despite differences, MEA countries share an ambition: to remain energy exporters – whether in hydrocarbons, hydrogen, or electricity. Their abundant resources and proximity to Europe and Asia support ambitions to be future energy hubs. North Africa eyes electricity and gas exports to Europe, while Saudi Arabia, Oman, and the UAE advance blue and green hydrogen, though most projects are still at early stages.
The energy transition indicators
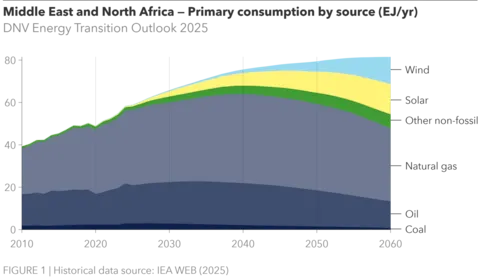
Primary energy consumption (EJ/yr)
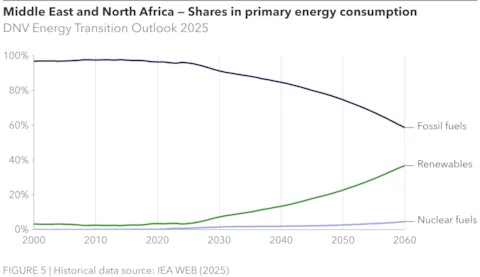
Despite recent progress in green initiatives, MEA remains heavily dependent on fossil fuels. Their share in the energy mix is projected to decline from 96% today to 58% by 2060. Over the same period, primary energy supply rises by 40%, from 58 EJ/yr to 82 EJ/yr, with most of this growth occurring before 2040, driven largely by natural gas increasing from 34 EJ/yr to 42 EJ/yr.
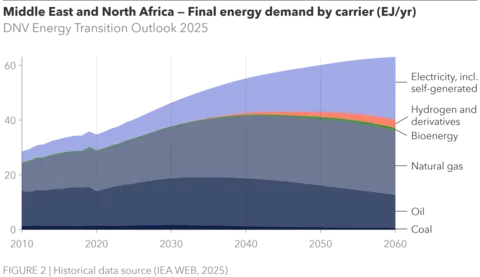
Final energy demand (EJ/yr)
Between now and 2060, final energy demand rises by 60%, from 39 EJ/yr to 63 EJ/yr, in line with population (36%) and GDP per capita growth (74%), while primary energy supply will grow by only 40%. This reflects a more efficient energy system and rising electrification, with electricity’s share of energy demand doubling from 17% today to 34% in 2060, while fossil fuels in energy demand (excluding in power generation) drop from 82% to 57%.

Electricity generation (PWh/yr)
Between 2024 and 2060, annual utility-scale electricity generation more than triples (330%) from 2.3 PWh to 7.7 PWh, excluding 0.8 PWh from behind-the-meter. To meet this rising domestic demand, investment in solar, wind, and storage is accelerating. Currently, fossil fuels generate 87% of the region’s electricity, but by 2040, renewables are expected to take the lead, reaching 87% of total power generation (6.7 PWh) by 2060.
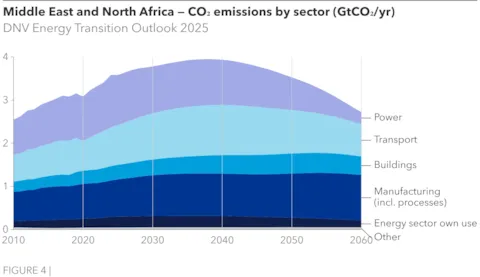
CO2 emissions by sector (GtCO2/yr)
Energy-related CO₂ emissions in the region are projected to peak around 2040 at 3.5 GtCO₂/yr, up from 3.2 GtCO₂/yr today, before falling to 2.2 GtCO₂/yr by 2060 – a 31% decline from 2024 levels after counting emissions captured by CCS. The power sector has long contributed about 36% of emissions, but as renewables expand, transport is set to become the largest emitter after 2030, reaching 34% of total emissions by 2060.
Dominant in oil and gas, with strategic diversification
The Middle East and North Africa is a highly diverse region, ranging from wealthy producers like Qatar, which can finance energy and climate initiatives largely on its own, to lower-income countries such as Yemen that depend on external support. While Turkey stands out as a major importer, most MEA countries are oil and gas exporters, and hydrocarbons remain central to the region’s economy.
Even in 2060, fossil fuels will dominate the region’s energy supply
Despite recent progress in green initiatives, MEA remains heavily reliant on fossil fuels and is projected to hold the largest share of global oil and gas demand by 2060 at about 21%. As shown in Figure 1, primary energy supply is expected to grow by 40%, from 58 EJ/yr to 82 EJ/yr, from 2024 to 2060. Most of this growth occurs before 2040, primarily driven by natural gas use rising from 34 EJ/yr to 42 EJ/yr. After 2040, energy demand grows more slowly, as electrification expands and more energy-efficient non-fossil sources make up a greater share.
By 2060, fossil fuels are still expected to account for 58% of MEA’s energy mix, down from 96% today. Oil, gas, and coal shares will decline from 59%, 32%, and 5% today to 42%, 15%, and 1%, respectively. Solar will grow to 17% and wind to 16%, yet MEA will still rank among the lowest globally in solar share, behind only North East Eurasia (NEE) and Sub-Saharan Africa (SSA).
With renewables reaching just 37% of primary energy by 2060, the second lowest globally after NEE, the region’s energy transition is relatively slow, constrained by the availability of cheap hydrocarbons. Still, geographic and economic diversity across MEA means energy transition pathways will vary across countries.
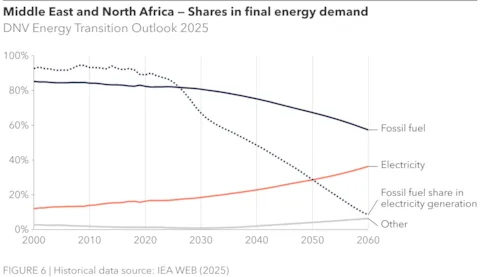
Electricity’s share in final energy demand doubles in 2060
Between now and 2060, final energy demand is projected to rise by 60%, from 39 EJ/yr to 63 EJ/yr, in line with population growth of 36% and GDP per capita growth of 74%. However, primary energy supply expands by only 40%, reflecting the impact of rising electrification. Electricity’s share of final energy demand doubles from 17% today to 34% in 2060. As shown in Figure 2, the share of fossil fuels in energy demand declines from 82% to 57%, while in power generation their contribution drops from 87% today to just 8% by 2060.
Demand sectors
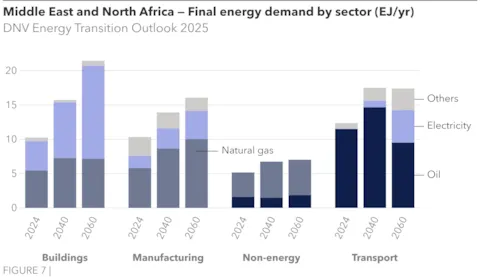
Historically, the transport sector has been the largest energy demand sector in the region, accounting for around 30% of total demand. This will remain the case until 2045, when it is overtaken by buildings (Figure 7). Transport demand is expected to rise from 12 EJ/yr today to 18 EJ/yr by 2040, plateau for about a decade, and then decline slightly to 17 EJ/yr by 2060.

Transport
As shown in Figure 8, road transport will continue to dominate the sector, making up 83% of total transport demand until around 2050, before gradually falling to 79%. Energy demand in road transport is projected to peak at around 15 EJ/yr in 2045, then decline modestly to 14 EJ/yr by 2060 as electric vehicle (EV) adoption expands. EV targets are ambitious in several countries: the UAE aims for 50% of all passenger vehicles and 70% of buses sold nationwide to be electric by 2050; Saudi Arabia targets 30% of vehicles in Riyadh to be electric; Oman aims for 35% of new vehicle registrations to be EVs by 2030; Turkey has aggressive targets for EV growth, aiming to reach 20% or more of the total vehicle fleet by 2034 and a 30% share of new car sales by 2030. Despite these efforts, we expect electricity to account for only 33% of the road transport energy mix by 2060. A major limiting factor is widespread fossil fuel subsidies, particularly for gasoline, which remain in place across many oil-producing countries in the region. These subsidies reduce the economic incentive to shift away from oil, and despite their well-known distorting effects, they continue to play a central role in the social contract between governments and citizens.
Buildings
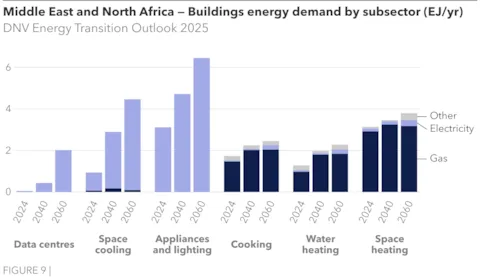
Buildings are the fastest-growing energy demand sector through 2060, with electricity use rising from today’s 4 EJ/yr to 12 EJ/yr. This surge is largely driven by a five-fold increase in space cooling demand (Figure 9), fuelled by global warming, population growth, and rising living standards. Additionally, demand from appliances and lighting is set to double to 6 EJ/yr, further contributing to the overall increase. Demand from data centres, which is negligible today, is expected to reach to 2 EJ/yr by 2060.
Manufacturing
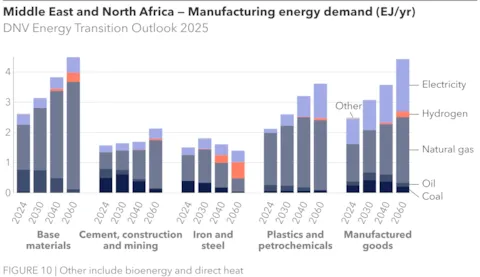
Manufacturing demand is set to grow by 60% over the outlook period, from 10 EJ/yr to 16 EJ/yr. As shown in Figure 10, nearly all subsectors see rising energy needs. The region’s abundant, low-cost gas provides a competitive edge in energy-intensive industries like fertilizer and alumina, while carbon prices remain low. This gas advantage also supports cost-competitive hydrogen production, enabling cheaper low-carbon products. Yet, despite this capacity, current manufacturing efforts and ambitions remain modest and the region’s potential underutilized due to structural and strategic challenges related to its historical dependence on oil, limited industrial diversity, and global competition. Electricity and hydrogen’s share in manufacturing energy demand will be 26% and 7% respectively, up from 17% and near zero today.
Electricity mix: 87% fossil fuel in 2024 to 87% renewables in 2060
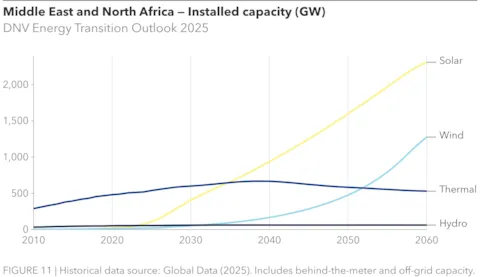
Between 2024 and 2060, annual utility-scale electricity generation more than triples (330%), from 2.3 PWh to 7.7 PWh (excluding 0.8 PWh from behind-the-meter), while electricity’s contribution to final energy demand doubles, rising from 17% to 34%. To meet rising domestic demand, investment in solar, wind, and storage is accelerating. Currently, fossil fuels generate 87% of the region’s electricity (Figure 3), but by 2040, renewables are expected to take the lead and will reach 87% of total power generation (6.7 PWh) by 2060.
Across the region, especially in the Gulf Cooperation Council (GCC), green initiatives are complementing fossil fuel strategies. Countries are scaling up renewables to meet domestic needs and free up hydrocarbons for export. Despite varying national priorities, abundant solar and wind resources could support major growth. For example, in 2024, Egypt launched its 2024–2030 Economic Strategy, setting key energy goals: raise renewable energy’s share in the power grid to 42% by 2030, complete interconnection projects with Saudi Arabia, Sudan, Jordan, Greece, and Italy, and boost electricity exports to 1.5 GW daily (IEA, 2025). In 2024, Morocco approved the construction of two new solar power stations near Khouribga, covering 241 hectares, to boost its renewable energy capacity and achieve a target of 52% by 2030, and 80% by 2050 (AEP, 2024).
While solar and wind are almost absent from the current power mix at 5% combined, they are expected to provide 36% and 48%, respectively, of the region’s electricity by 2060. Just over half of this solar electricity generation is expected to be in solar+storage. We forecast 44% of wind power in 2060 to be onshore, with fixed offshore wind farms constituting 3% of total electricity generation and floating offshore expected to be around 1%.

Middle East and North Africa will produce 44% of global oil and gas in 2060
Investment in oil and gas exceeds renewables in the region, driven by profitability, strategies to expand market share, and the sector’s critical role in national economies, especially where hydrocarbons dominate GDP and drive growth. Currently, MEA is the largest oil-producing region, accounting for 36% of global production in 2024, around 30 million barrels per day (Mbpd). Oil production is projected to climb to 40 Mbpd by 2030, even as long-term demand tapers. Although volumes will decline to 21 Mbpd by 2060, the region’s share in global oil production will rise to 53%, consolidating market power. Natural gas will follow a similar trend: current production is about 1,250 billion cubic metres (Bcm) per year, with a 25% share of the global market. The region is set to overtake North America by 2030, reaching 1,660 Bcm by 2040 and will maintain 40% of global production by 2060, despite a drop to around 1,420 Bcm.

The region's oil exports are primarily directed to China, Europe, India, Japan, and South Korea. Figure 13 shows the region's gas export destination via LNG and pipeline. Although gas demand in Europe is projected to decrease, leading to reduced exports, LNG demand in China and India is expected to rise over the next two decades.
Electrification of the oil and gas industry is key to reducing Scope 2 emissions
Oil and gas companies can significantly reduce their Scope 2 emissions by replacing oil and gas in their own energy use (for heat generation, compressors, pumps) with electricity, especially from renewable sources. GCC national oil companies are already moving in this direction. In 2024, ADNOC achieved an upstream carbon intensity of about 7kgCO2e/boe and reduced Scope 1 and 2 emissions by 6.6 MtCO2e, of which approximately 5 MtCO2e came from clean power imports (sourced from solar and nuclear) (ADNOC, 2025). Saudi Aramco decreased their Scope 2 emissions by 4.6% compared to 2023, due to a reduction in the emission factor of imported power and steam (Aramco, 2025). In Kuwait, KOC piloted the Sidrah solar project to electrify pumping operations, while Oman’s PDO is advancing large-scale solar projects and planning one of the world’s first fully solar-powered LNG facilities (operation expected 2028).
Oil and gas commitment is necessary for methane reduction
Nearly all MEA countries, except for Algeria, Iran, and Syria, have signed the Global Methane Pledge or are in the process of joining. Commitments across the region vary in ambition depending on national policies and production profiles, given the oil and gas sector’s outsized methane emissions. Gulf national oil companies are emerging as front-runners in tackling methane, investing in advanced technologies and operational practices to curb fugitive emissions, venting, and flaring in the industry. ADNOC has set one of the world’s lowest upstream methane intensity targets (0.15% by 2025) and is rolling out advanced leak detection and flare recovery systems. Saudi Aramco reports one of the lowest methane intensities globally at 0.04%, aims to cut emissions further, and has partnered with GHGSat to use satellites for leak detection. QatarEnergy has joined the Oil and Gas Climate Initiative’s Aiming for Zero Methane by 2030 initiative and is enhancing monitoring and flaring reduction.
Hydrogen and derivatives are new export pillars
To reduce reliance on oil and gas revenue, the region is positioning itself as a hub for low-carbon hydrogen and ammonia. Saudi Arabia, UAE, and Oman have issued ambitious hydrogen strategies and are set to exploit abundant access to solar and wind power and use natural gas reserves for blue hydrogen. Saudi Arabia plans to produce 600 tonnes of green hydrogen using 4 GW of renewable energy at its NEOM project, which is expected to be operational by 2027 (NGHC, 2025). The UAE aims to produce 1.4 million tonnes of hydrogen per year (MtH2/yr) by 2031, with ambitious plans to scale up to 15 MtH2/yr by 2050, supported by significant solar and electrolyser infrastructure (GH2, 2025). Oman aims for 1-1.25 Mt/yr of green hydrogen by 2030, increasing to 3.75 Mt/yr by 2040, and reaching 8.5 Mt/yr by 2050 (Al-Rawahi, 2025).
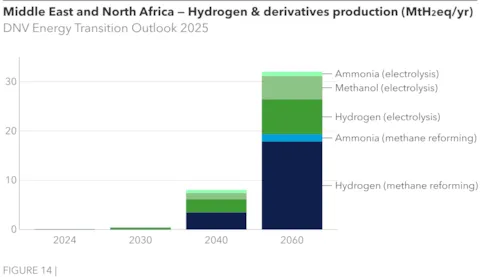
Ammonia and methanol projects are largely on track in the region, leveraging existing gas infrastructure, easier transport, and clear export demand. Blue hydrogen is and will remain the most economically viable route throughout the forecast period, due to low prices for locally extracted natural gas and CCUS integration. The levelized cost of hydrogen for blue hydrogen, the second cheapest after grey hydrogen, is expected to decrease by 26% from USD 2.3 to USD 1.7/kgH2. Currently green hydrogen lags due to high costs, water scarcity, and lack of offtake agreements. However, foreign investment – driven by technology partnerships, clear policy, and export potential – is accelerating momentum, backing hydrogen, ammonia, and renewables projects. Hydrogen and ammonia production are set to reach 6 MtH2/yr and 4 MtNH3/yr by 2040, rising to 25 MtH2/yr and 13 MtNH3/yr by 2060 (Figure 14).
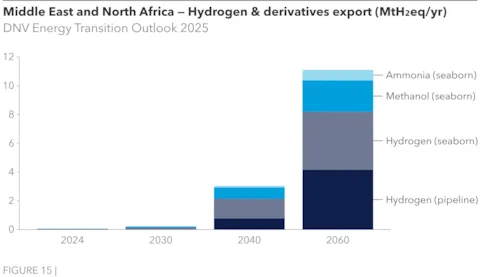
Regional hydrogen demand is expected to remain moderate and below production levels. Thanks to cost-effective low-carbon hydrogen and a strategic location between major growth markets in the east and west, Middle East and North Africa is poised to become the world’s largest hydrogen exporter. By 2060, we project the region to export around 8 MtH2/yr – mainly to Europe, Japan, and South Korea via pipeline and seaborne trade – along with about 4 Mt/yr of ammonia and 17.5 Mt/yr of methanol (Figure 15). MEA and North East Eurasia lead global hydrogen exports, exporting nearly equal volumes and far exceeding all other regions. However, the numbers are still relatively small and dwarfed by oil and gas exports.
Carbon capture key to decarbonizing oil and gas and unlocking blue hydrogen
Carbon capture, utilization, and storage (CCUS) is critical but still early-stage, with most projects in pilot phases or tied to enhanced oil recovery. However, significant regional investment is accelerating capacity as countries seek to enhance competitiveness by lowering the carbon-intensity of hydrocarbon production. Operators are increasingly exploring storage and utilization options to support broader decarbonization efforts in other sectors, including hydrogen production, power, and manufacturing. Carbon capture from natural gas processing is expected to reach 11 MtCO₂/yr by 2030 – accounting for 75% of all energy-related captured carbon – and rise to 18 MtCO₂/yr by 2060, accounting for only 7% of captured carbon.
As hydrogen and ammonia production expands across the region, prominent entities like Aramco, ADNOC, and QatarEnergy have teamed up with global firms to explore and capitalize on opportunities within blue hydrogen and CCUS projects. Projects in development, under construction, and already operating in Qatar, Saudi Arabia, and the UAE have a combined capture capacity of 19 MtCO₂/yr (operational capacity was 5 MtCO2/yr as of October 2024). There is also a range of planned projects in the GCC countries; these forward-looking initiatives underscore the region's high CCS ambitions.
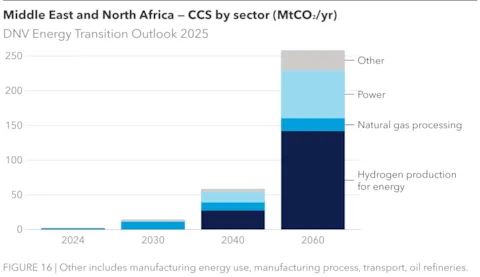
Figure 16 shows the projected scale-up of CCS in the region. By 2060, carbon capture in blue hydrogen production is expected to reach 142 MtCO₂/yr, accounting for 55% of carbon captured and stored in the region, followed by the power sector with 69 MtCO₂/yr (27%). Total captured emissions are projected to reach around 260 MtCO₂/yr, equivalent to roughly 12% of the region’s energy-related emissions, by 2060. Despite being the world’s largest oil and gas producer and consumer in 2060, the region’s CCS deployment remains smaller than in other producing regions, such as North America (460 MtCO₂/yr) and North East Eurasia (300 MtCO₂/yr).
Looking to carbon dioxide removal (CDR): bioenergy with CCS (BECCS) will pick up after 2030 and direct air capture (DAC) after 2040, reaching 83 MtCO₂/yr combined in 2050. For details about CDR see Chapter 8 of the Energy Transition Outlook 2025.

Emissions drop only after 2040
Carbon pricing is currently low or negative given fossil-fuel subsidies, and we expect slow adoption. Our projection (see Chapter 6 of the Energy Transition Outlook 2025) for the regional average carbon price is USD 10/tCO2 in 2030 and USD 37/tCO2 in 2060.
In the context of global climate policy, country pledges in nationally determined contributions (NDCs) indicate that the Middle East and North Africa, viewed as a region, has a target for emissions to increase by no more than 184% by 2030 relative to 1990. Most Middle Eastern emission targets are given relative to a business-as-usual trajectory. Our Outlook suggests that energy- and process-related CO2 emissions (after CCS and DAC) will have increased by 270% by then.
Energy-related CO₂ emissions in the region are projected to rise steadily and peak around 2040 at approximately 3.5 GtCO2/yr, up from today’s 3.2 GtCO2/yr. By 2060, emissions (after accounting for CCS) are expected to decline by about 31% from 2024 levels, reaching 2.2 GtCO2/yr. As shown in Figure 4, the power sector has contributed roughly 36% of total emissions over the past three decades. However, with renewables increasingly dominating power generation, the transport sector is expected to become the largest emitter after 2030, accounting for an estimated 34% of total emissions by 2060.
Today, the region's per capita energy-related CO2 emissions stand at 5.5 tonnes per person, which is higher than the global average of 4.3 tonnes per person. By 2060, the per capita emissions will fall to 2.7 tonnes per person, but this reduction is slower than the global average and still double the global average emission of 1.1 tonnes per person.
Process-related emissions, originating from industrial production processes rather than fuel combustion, are typically by-products of chemical reactions involved in producing materials such as cement. These emissions are projected to increase from 38 Mt in 2024 to 50 Mt by 2060.
Despite the region’s ambitious net-zero targets, effective carbon pricing and emission abatement policies will be key imperatives if these countries are to reach their stated objectives by 2050 and 2060.
Policy summary
A non-exhaustive list of sector policy initiatives, emphasizing the 2024 to 2025 period
|
Climate targets - Key countries Israel, Oman, and the United Arab Emirates (UAE) net zero by 2050. Turkey by 2053. Bahrain and Kingdom of Saudi Arabia (KSA) net zero by 2060. |
||
|
Sector |
Policy details and example initiatives |
Mechanism(s) |
|
Power |
> Renewable generation is promoted by national targets. KSA targets 130 GW capacity and 50% renewable generation by 2030, UAE targets 14-20 GW capacity and 30% of electricity from clean sources by 2030. Jordan aims for 50%, Morocco for 52% by 2030, Turkey for 65% by 2035, and Egypt for 42% by 2040. > Besides tenders, incentives include transmission fee and tax-related exemptions, allocation of government-owned land, such as in Turkey. |
Tenders/auctions for 20- to 25-year PPAs with state entities. Feed-in-tariffs in Turkey with guaranteed, fixed price over 10 or 15 years, if local technology content.
|
|
> Policy advances different energy storage systems, with battery energy storage systems (BESS) dominating developments. An increasing number of solar PV and wind projects are co-located with large batteries. The Gulf Cooperation Council (GCC) countries lead developments; KSA targets 48 GWh by 2030, providing 15-year storage service agreements. |
Requirements for storage deployment Tenders/auctions Fixed year storage agreement |
|
|
> Nuclear energy policies aim to increase capacity in balance with renewable energy growth. > Egypt has units under construction, the UAE plans a 6% nuclear share of electricity by 2050, and Turkey aims for 20 GW by 2050 under ‘build-own-operate’ contracts, |
State assurances Government funding Cooperation agreements, international partners |
|
|
Grids |
> Rising electricity demand and renewables growth drive investments in grids. Plans focus on renewables integration, smart tech and regional interconnections. > GCCl Interconnection Authority (GCCIA) invests USD 1.1. to 1.3 billion in network expansion from 2025-2027 such as the Oman/UAE interconnection project financing agreement in September 2025. > The Pan Arab Electricity Market is advancing with the signing of the market agreements in December 2024 to expand electricity trade, also supported by the World Bank. |
Public investment Regional cooperation International finance
|
|
Hydrogen |
> Algerie, Oman, KSA and UAE aim to become export hubs for green ammonia hubs, leveraging geography and renewables. KSA and UAE have begun exports to Japan. > GCC countries, backed by sovereign wealth funds (e.g., NEOM, Saudi Arabia), are investing in low-carbon and renewable hydrogen. In October 2024, KSA’s Public Investment Fund launched a new entity to invest USD 10 billion in green hydrogen production. > Project opportunities emerge from hydrogen corridor ambitions to Europe, such as the MoU signed in February 2025 between ACWA Power, as developer, and German government-owned SEFE, as offtaker for 200,000 tonnes renewable hydrogen by 2030. |
Sovereign wealth fund investments Government funding |
|
CCS/DAC |
> Gulf countries advance CCS and government control over value chains is strong in KSA, Qatar, and the UAE with state-owned entities leading full-chain development > The UAE targets 10 MtCO2/yr capture capacity by 2030, KSA targets 44 MtCO2/yr, and Qatar aims for 11 MtCO2/yr by 2035. > Turkey focuses on CCS in heavy industries. Algeria and Egypt are developing regulatory frameworks. See DNVs Energy Transition Outlook: CCS to 2050 for further details. |
Sovereign wealth fund investments State-owned entities Government funding |
|
Transport |
> There are increased efforts in electrification of road transport through combinations of incentives (tax and fee incentives, purchase rebates) such as in KSA, UAE, Morocco and Tunisia, and charging infrastructure. Egypt and Qatar promotes EV fleets in public transportation > Gulf countries invest in clean fuels for aviation and shipping. UAE targets 700 million litres of SAF production annually by 2030. There are international partnerships for pilot/feasibility stages. No binding SAF mandates exist. Turkey proses a 1% blend by 2026, rising to 5% in 2030. |
Public infrastructure investment Financial incentives
Government funding State-owned entities International partnerships |
|
Manufacturing |
> Industrial decarbonization features in climate roadmaps via electrification and hydrogen, but no explicit legislated timelines or mandates exist. In May 2025, Egypt signed an MoU with the Industrial Transition Accelerator to support heavy industry emission cuts. > Large industrial projects advance green hydrogen: fertilizer production (Morocco’s OCP green ammonia plant), refining (Saudi Aramco), and steel plants under pilot and scaling phases to demonstrate feasibility. |
Technology roadmaps
Government funding to R&D, pilots
International partnerships |
|
Buildings |
> Policy predominantly focus on efficiency. KSA revised its efficiency and retrofit programme (2024), Turkey has efficiency and 5% renewables rules for new builds, the UAE focus building standards on energy efficiency, water management, and sustainable building materials. At COP29, the UAE launched the Global Energy Efficiency Alliance to help double global energy efficiency by 2030. |
Standards
Partnerships |
References
IEA (2025). Egypt's economic strategy for 2024-2030. February 2025.
AEP (2024). Morocco Advances Renewable Energy Goals with Two New Solar Power Stations. September 2024.
ADNOC (2025). 2024 Sustainability Report 2025.
Aramco (2025). Climate change and the energy transition.
Arkeh, J., Hamzawy, A. (2024). ‘Climate Change in the Middle East and North Africa: Mitigating Vulnerabilities and Designing Effective Policies’. Carnegie.
Kuzma, S., Saccoccia, L., Chertock, M. (2023). ‘25 Countries, Housing One-Quarter of the Population, Face Extremely High Water Stress’. World Resources Institute.
Munich RE (2025). Climate change is showing its claws: The world is getting hotter, resulting in severe hurricanes, thunderstorms and floods.
NGHC (2025). World’s Largest Green Hydrogen Plant release first-ever footage after achieving more than 80% Construction Completion across all sites. September 2025.
GH2 (2025). GH2 Country Portal – United Arab Emirates 2025.
Al-Rawahi (2025). Powering the Future: How Oman Is Building the World’s Green Hydrogen Corridor Gulfif 2025.