Windiness 2020: A geospatial overview of wind resource – what are the implications for you?
What do the 2020 results mean for you?
Monitoring and recording wind speed trends can be beneficial to assess project performance. But interpreting and truly understanding those trends are where the real value lies. So, what do the 2020 wind speed results mean for you?
In our last article, we assumed a long-term reference period between 1996-2019 to present our findings on the UK Windiness index. This revealed an increase in wind speeds of 6%.
In this overview, we assess the ‘windiness’ for the subregions of Northern Europe (UK & Ireland, Benelux, Scandinavia & Baltics), Middle East (Near East & Arabian Peninsula) and Africa. We are using a common long-term reference period between 2000-2019 to assess the wind resource in 2020 for consistency across each region. It is noted that for a more thorough assessment on a country-level, the consistency of the data making up the index for each country, should be investigated.
Below we present the Annual Windiness Index for these regions, which represents the wind speed snapshot of 2020 against the long-term mean wind speed.
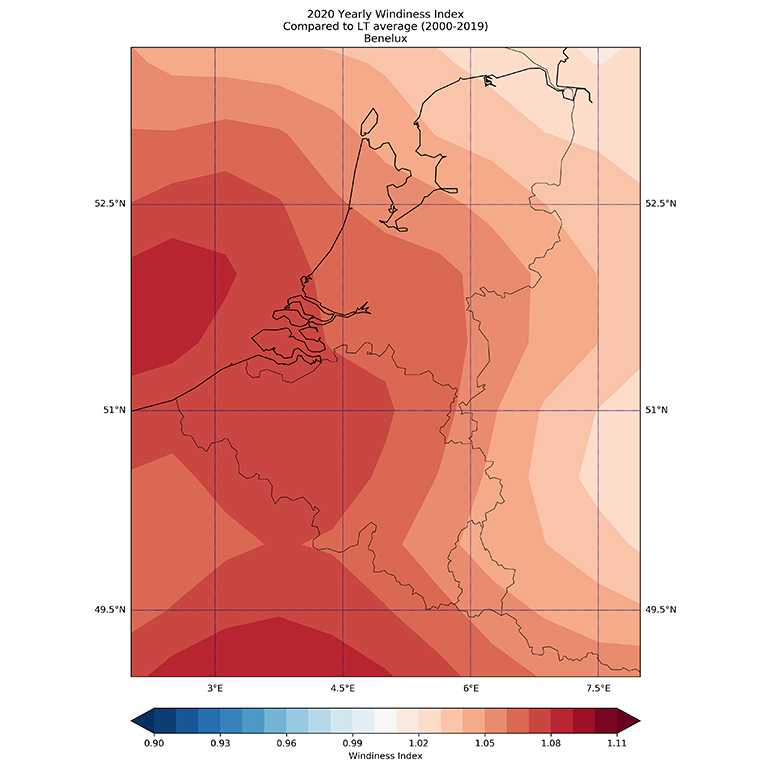
Benelux wind speed trends
Wind speeds in Benelux were stronger across the entire region in 2020 with a distinct pattern of higher anomalies in the Western parts which dissipated when moving eastwards. Western Belgium recorded an index of 1.07 which meant a 7% increase in mean annual wind speeds. This dropped to an increase of 5-6% for the Eastern part of the country and Luxemburg. The Netherlands also experienced a windier year than usual with a distinct geographical distribution that showed increased wind resource in the southern parts of the country. This windier period can be mainly attributed to an increased number of storms that originated in the Atlantic Ocean and also affected the wind resource in the UK. A strong North Atlantic Oscillation is also associated with an increased storm frequency in Northern Europe.
This positive anomaly can be attributed mainly to a very strong first quarter of the year when wind resource exhibited record increases in wind speeds of 22% for the entire region. Quarter two was slightly lower than expectations for that time of the year while we observed a positive seasonal anomaly of 3-4% for Western parts of Benelux and the Southern offshore region of the North Sea in quarters three and four.
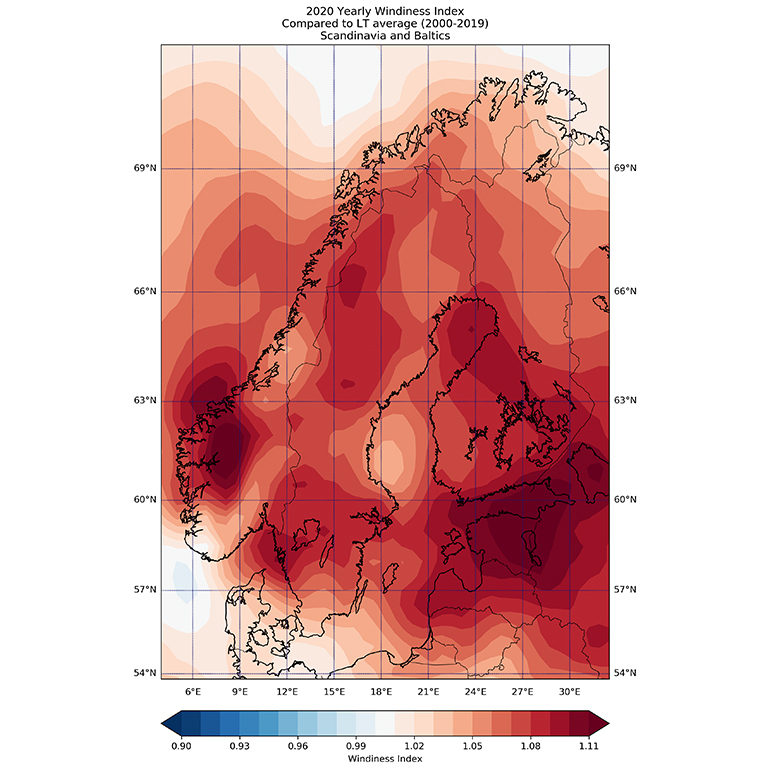
Scandinavia and Baltics wind speed trends
Scandinavia and the Baltics witnessed a similar story to the rest Northern Europe, following the same wind anomaly patterns throughout.
A very strong first quarter meant record mean wind speeds in the Southern parts of Norway, Sweden and Finland which recorded positive deviations from the long-term reference of more than 20%. Similar findings were found in Baltic countries during quarter one which showed mean seasonal wind speeds recording deviations in the range of plus 15-20%. The rest of the year continued in a positive trend as well across the entire region, except in Denmark where wind speeds were found to be weaker than usual, when compared to the long-term.
Norway recorded an Annual index in the range of 1.03-1.11 (i.e. a 3-11% increase), Sweden recorded between 1.03-1.08 and Finland between 1.02-1.07. Denmark observed a mean annual deviation of approximately 2%. The Baltics were also on the positive side as Estonia recorded an index of greater than 1.11 while deviations were smaller but still higher than usual in Latvia and Lithuania (1.04-1.09).
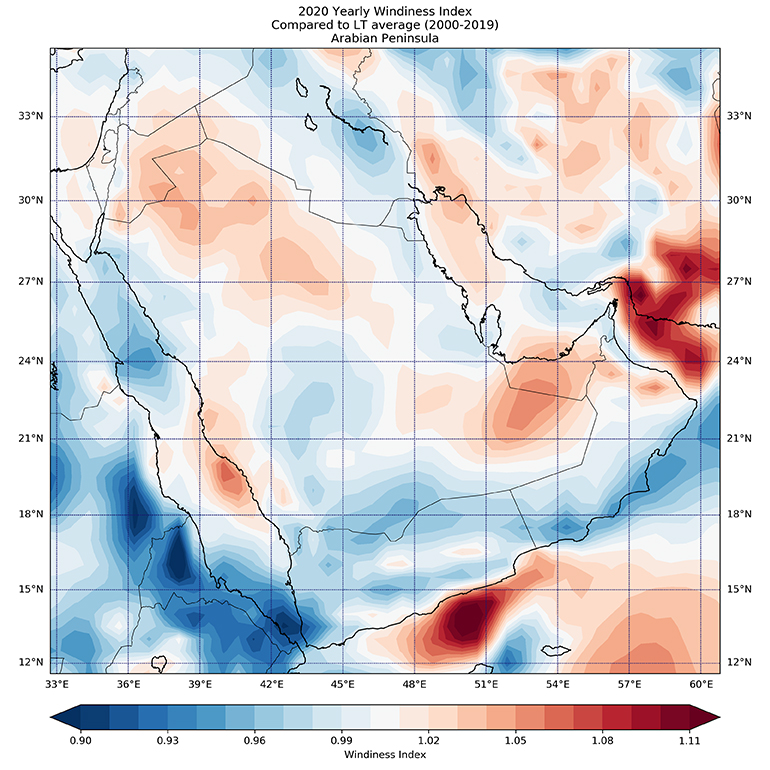
Near East and Arabian Peninsula wind speed trends
There was a completely different story in this part of the world where wind speeds followed a rather normal trend across 2020. Deviations around the region were in a range between -4% to +4% and wind followed different trends over the course of the year.
Almost all countries exhibited a stronger than usual first half to the year during which wind speeds were higher than their respective seasonal means in the range between 3-6%. Lebanon, Israel, Jordan and the UAE observed higher wind speeds during the first six months of 2020 while the rest of the region did not observe any significant anomalies.
However, in the second half of the year a reversed pattern was observed for the aforementioned countries, except for the UAE, which levelled out the Annual Windiness Index for the region. The UAE recorded an Annual Index of 1.04, Lebanon and Israel around 1.00 (i.e. no significant deviations for the year) and Jordan around 1.03. Oman and Yemen on the other hand experienced weaker wind speeds in 2020 while Saudi Arabia had parts with small deviations (+/- 2%) across its territory.
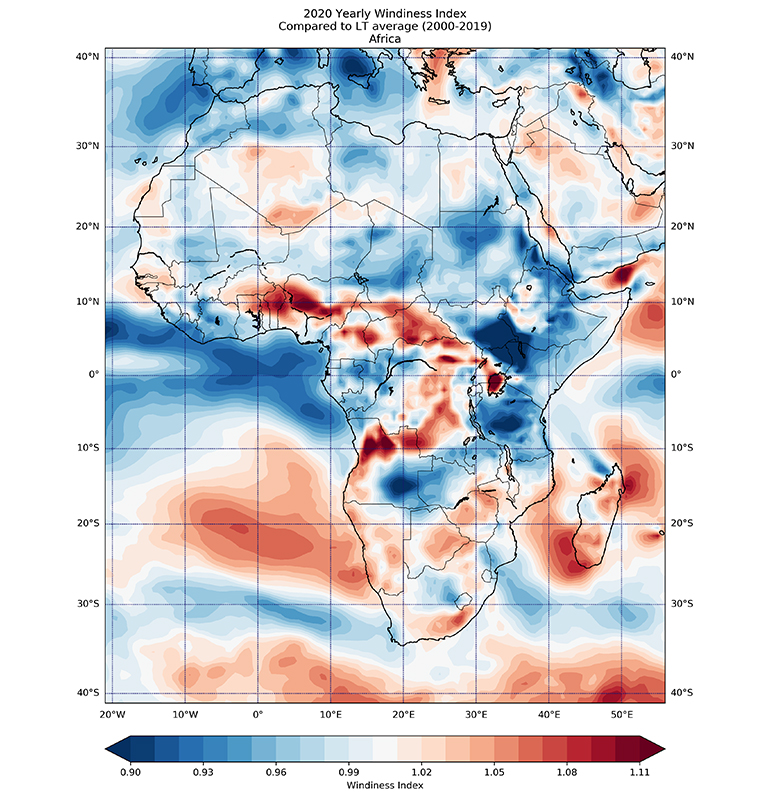
Africa wind speed trends
Africa generally experiences normal wind speed trends around the equatorial countries due to the general atmospheric circulation and the Easterly winds. While in its Northern and Southern regions, Westerly winds are usually predominant. In most parts of Africa, Trade winds are responsible for constant high surface mean speeds of 10 m/s which make the region very suitable for wind energy developments. In this section, we will look at the African regions where large wind farms are already in operation, such as Kenya, South Africa, Morocco and Egypt.
Kenya, one of the African equatorial countries is blessed with constant high wind speeds across the year and is host to the largest wind farm in Africa, Lake Turkana 310 MW. However, Annual mean wind speeds in Kenya were significantly lower than the long-term reference mean in the range of minus 10%. Winds were weaker during each half of the year, so naturally the wind farms in the regions were expected to generate lower energy than normal expectations.
South Africa recorded higher wind speeds during each half of the year where most wind farms were operating with Annual Indices around of between -4% to +7%.
North African countries (Morocco, Tunisia, Libya and Egypt) observed lower wind speeds than the long-term expectations. This region usually follows the general trend of the Mediterranean countries where atmospheric circulation is linked to the North Atlantic Oscillation (NAO) phases. NAO was on its positive phase during quarter one and quarter four, so this is naturally linked to a higher frequency of storms and stronger winds in Northern Europe, whereas the Mediterranean is drier and less windy. A strong winter NAO led to lower wind speeds in 2020 across North Africa which had a profound impact on the Annual Windiness Index; the North Africa countries recorded mean wind speeds 4-5% lower than the long-term expectations.
Interpreting the data to establish an answer
But what do the wind speed anomalies during 2020 represent for owners, investors and developers?
Wind farm owners can expect to have seen higher production at projects during 2020, compared to the long-term, where the Windiness Index was positive and vice-versa. Using typical project wind speed to energy sensitivity ratios, it is noted that a 2% increase in wind speed corresponds to an increase of approximately 3-4% in terms of energy production. This should be taken into consideration during reviews of project performance. Investors have seen higher energy productions in wind projects when compared to 2019 due to increased wind resources during the windier quarter one and quarter four in the European regions, normal energy productions in the Arabian Peninsula and lower energy in Central Africa.
Wind farm developers who have been conducting wind measurements in Northern Europe during 2020 can also expect the average wind speed to be higher than the same period in 2019 and higher than in the long-term. This trend should be taken into consideration when adjusting measurements to be representative of a long-term period.
However, the observed 2020 deviations from the long-term mean wind speed are noted to fall within the expected range of wind speed inter-annual variability. Therefore, these events are expected to be covered by “industry standard” assumptions for future wind speed uncertainty, as modelled in energy production assessments.
DNV's Wind Index
DNV maintains multiple Wind Indexes for various countries and regions, which enables investors, owners and investors to assess the performance of potential or operating projects. Likewise, the Wind Index is a robust tool for wind farm developers, empowering them to understand the ‘windiness’ of their wind monitoring campaigns compared to a long-term period.
The long-term reference period represents all years between 2000 and the year prior to the analysis. The Wind Index is normalized so that the average wind speed over the long-term period is 100%. The windiness of any given period is expressed as a percentage of the long-term average wind speed. Thus, a value exceeding 100% (or 1) indicates that a period was windier than the long-term average, whilst a value below 100% (or 1) suggests that a period was less windy.
About DNV
DNV now offers a new service for your Portfolio, generating bespoke Windiness Reports delivered to you every month. This includes an average of your entire portfolio and a breakdown of each one of your assets. For more information please contact Ioannis Agiol.
Learn more about our full range of services and products.
4/14/2021 6:00:00 AM