Skip to content

What is needed to perform a RAM Study?

Maros and Taro require some basic information to run a study. This article aims at answering: What is needed to perform a RAM Study?
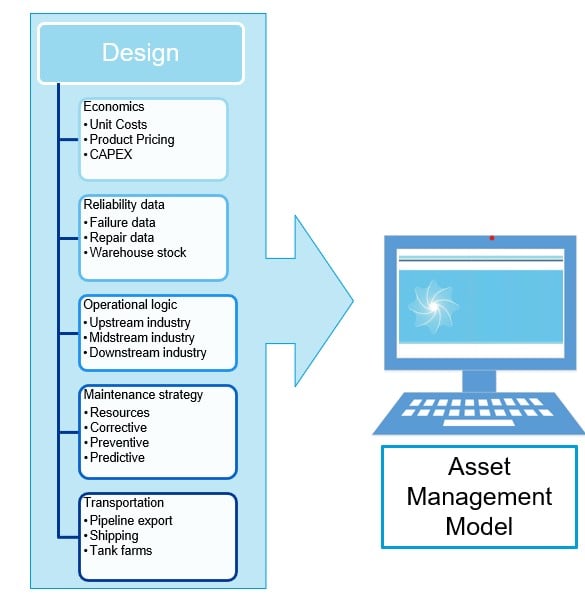
Plant - What is needed to perform a RAM Study? - inputs-1

Design basis

The first step of any project aiming at building a RAM model involves becoming familiar with the system design that you are about to convert into the digital twin. This might include looking into operations and maintenance strategies but let’s leave that discussion till later on.

The initial pieces of information required are:

  • System Life:
    • For design studies, this would be defined as the design life
    • For studies during operations, it might refer to a specific period of time e.g. 5 years, the next business plan cycle.
  • Design capacity of the different units
  • Equipment list: this data will vary depending on the study level.
    • For the design phase, production-critical items are typically used
    • For manning studies, non-production critical items would also be included to assess the delays related to maintenance logistics

A number of documents can be used to achieve the goal of the last bullet point. Amongst the most important documentation, I would refer to:

  • Process Flow Diagrams (PFDs): A PFD is a diagram commonly used in engineering to indicate the general flow of plant processes and equipment.
  • Process and Instrument Drawings (P&IDs): A P&ID includes more details than a PFD. It includes major and minor flows, control loops and instrumentation

These diagrams will be used to transform design information into a Block Flow Diagram (BFD) and Reliability Block Diagram (RBD). A Block Flow Diagram (BFD) defines the connectivity of nodes and focuses on the production aspects of the system e.g. flow rates and product mass balances. Each node within the network will require its own Reliability Block Diagrams (RBDs). These are used to identify the system’s components and their operating mode.

Once we know what equipment items to be included in the model, we start looking into collecting reliability data.

Reliability data

Reliability data is the most difficult step in most projects. It is likely that the RAM analyst will run into situations where it is impossible to find data with high-confidence and tolerance. Therefore, it is important to know potential sources of reliability data:

  1. The best reliability data, is YOUR data. During the operational stage, reliability data can be derived from the computerised maintenance management system (CMMS).
  2. Generic data sources (OREDA, IEEE, EIREDA, etc.) are another source of information.
    More information here.
  3. Vendor data.
  4. Engineering judgement and available techniques (such as FTA) to identify failure modes for new technology where data is not available.
  5. We also have some data available in case it is needed.

The reliability data collected during this stage should be organised into failure modes. Depending on the stage of the project, this could refer to an equipment-level (i.e. a critical failure mode reflecting all possible failures) or component-level analysis. It is really important to standardise the definition of failure modes, for example by using ISO:14224 definitions; this will make performance comparable for the different units.

For each equipment item, the model will typically include one or more failure modes dependent on the selected data source. At this point, it is important to note that the data that is used the most reflects the following factors:

  • Failure and repair characteristics
  • Impact of scheduled shutdowns and slowdowns
  • Equipment redundancy, operating condition and sparing
  • If a FMECA is performed prior to the study, the relevant items will be identified by the semi-quantitative criticality analysis, which ranks failure modes according to their probability of occurrence and consequences. This can serve as a starting point for more detailed data analysis.

Quick stop here

The information above is enough to run a traditional RAM analysis. But if you wish to extend the digital twin into a proper asset performance management model, you could…

Operational and maintenance strategy

Defining the Operational strategy of any asset in the oil and gas industry starts by defining Reservoir data. This information is normally available to/from reservoir engineers for upstream operations. It will typically look like the following graph:

Plant - What is needed to perform a RAM Study? - production-profile

Typical oil production profile

In Refineries, this could be the feedstock profile or the design flow (design stage).

Once this has been added to the model, this opens the door to modelling a number of operating rules such as:

  • Buffer tanks: information from design documents
  • Boosting operations: information from operations team
  • Flaring operations: information from design and operations team
  • etc.

Then, you could move into modelling the different types of maintenance strategies:

  • Corrective Maintenance, by adding maintenance resources which will be shared amongst the different failures
  • Predictive Maintenance, by adding conditional monitoring
  • Planned Maintenance, this is typically done when you are adding failure and repair data as the frequency of planned shutdowns will directly impact the reliability data.

Plant - What is needed to perform a RAM Study? - maintenance


All these maintenance tasks can be prioritised, simulating specific maintenance strategies. Furthermore, special strategies such as Planned Renewals or Opportunistic Maintenance can be implemented.

The next step is adding the Transportation data.

Transportation information

Once the RAM model incorporates the product flow information (See? Everything is around the production profile!), the exporting strategy can be defined. This could be including all the design work related to the export pipeline (for gas pipelines, line packing is something important to consider).

If the export is done via bulk transport – ships and trucks, the Annual Delivery Plan (ADP) will be typically defined by a supply management team.

The next step is adding the financial data.

Financial information

Once the RAM model incorporates the product flow information (see? Everything is around the production profile. Repeating yourself?), a price can be associated to each stream. This will allow the Digital Twin to capture the revenue!

If Operational Expenditure data has been associated to the maintenance resources in the previous step, Maros/Taro will capture the entire expenditure for the asset.

This all can be used to calculate a Net Present Value.

Asset performance management is central to ensure low OpEx, right CapEx and best operations and maintenance strategy!

Plant - What is needed to perform a RAM Study? - inputs-and-results


Author: Victor Borges

2/16/2017 3:44:19 PM

Contact us

How can we help you?

Contact us

Read more blog posts

Back to blog overview