Qualitative VS Quantitative RBI: what are the benefits?
So, what’s the best approach Qualitative VS Quantitative RBI?
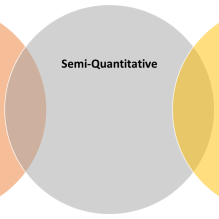
DNV compared the implementation of qualitative and quantitative Risk-Based Inspection (RBI) on a specific project. When implementing RBI, engineers can typically choose to perform the analysis at various levels of detail (qualitative, semi-quantitative and fully quantitative) and for various hierarchy level objects (system, corrosion circuit, tag, part) which is one of the application’s strengths. Typically, companies would start from a less detailed analysis (e.g. qualitative) and from a higher-level object (e.g. system) and optionally progresses to more detailed analysis and lower level objects, if the level of risk justifies such a detailed analysis.
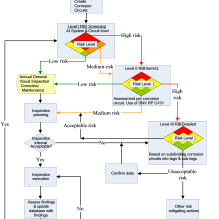
An example of RBI workflow that can be achieved with the software is shown in Figure 1:
- A screening analysis can start at high level e.g. at system level (or corrosion circuit level) with minimum data input. If the risk for the system is low, then no further analysis is required and general visual inspection / corrective maintenance is planned.
- If the risk is medium or high, then a screening (pure qualitative) or semi-quantitative analysis (e.g. qualitative Consequence of Failure combined with quantitative Likelihood of Failure) can be attempted at a corrosion circuit level. At this point, some more detailed data are required and corrosion circuits need to be defined.
- If the risk is still high a fully quantitative analysis can be conducted at tag or part level. This is a detailed analysis which requires data for the tags or sub-tags (parts) and can produce detailed inspection plans with optimized inspection intervals and techniques for each tag or part.
-

Figure 1: Example of RBI workflow in Synergi RBI
The different approaches have different benefits as listed below:

Benefits of RBI
To quantify the benefit of each approach, DNV evaluated an existing project where RBI was implemented for 500 equipment items and tried the two methodologies. As indicated in the Figures below, the qualitative analysis may be easier to start with, requires less data and it is easier to communicate outside the RBI team. In this case DNV estimated at 310 hours to go through all the 500 items. Approximately, the same time would be required to run a qualitative analysis for a second and third time.

The proportion of time taken in each stage:
- Data collection: 10%
- Data Analysis: 40%
- Inspection: 50%
On the other hand, quantitative RBI initially takes longer as it requires a considerable amount of time to collect the data. According to DNV’s estimate, it takes around 1 hour to gather and assess data for each equipment item, resulting in an initial investment of 500 hours. After the initial data has been acquired and processed, the second and third analyses less time. This will obviously impact the accumulated hours as well and, in the long-term, quantitative (i.e. ~900 hours) will be more effective than qualitative (i.e. ~ 930 hours), as indicated in the following figure:

Quantitative analysis will also see a different proportion of time spent in the different steps of the analysis. For the initial analysis, there will be a lot of time spent on gathering data but, once that step is done, focus will be placed in what is relevant – the Data and Inspection Analysis.

In conclusion, the qualitative analysis will provide some useful information at a much smaller cost. However, for an evergreen process, the quantitative approach is far more efficient. The initial data collected can be easily re-utilized and, for the next assessment, the process of collecting data is minimum and the focus is the data that has changed, reducing considerably the number of hours spent on it. In the case of the qualitative analysis, the engineer must go through the entire process again to ensure the risks of each of one of the equipment item has not changed.
Because of straightforward approach of the qualitative process, companies might want to start with that and then evolve their analyses to include quantitative aspects as data becomes more available.
Author: Simon Wong
8/22/2017 7:04:40 PM
