From FMECA to RAM studies
Failure Modes Effects Analysis (FMEA) and its extension, Criticality (FMECA), is a process analysis tool used to identify potential failures that could affect the performance of a piece of equipment and/or asset. In the oil and gas industry, FMEA/FMECA is often the first step of the RAM analysis. But how do you go from FMECA to RAM studies?
FMEA/FMECA is typically perceived as inherently simple but extremely powerful tool. In the oil and gas industry, the method allows analysts to systematically identify potential failure modes for equipment items (or an entire production process) and assess the risks associated with these failure modes. This approach enables the analyst to establish a qualitative criticality which can be based on categories such as safety, environmental, reputation, business and so forth. With information about the associated risk, corrective actions can be prioritized to address the most severe consequences. So the analysis gives you both where to focus and where not to focus.
To incorporate the criticality analysis on a more quantitative basis, the risk is evaluated by subjective measure of the severity and an estimate of probability. Depending on requirements, an additional level of risk needs to be captured. This is known and reported as the Risk Priority Number (RPN) and can be derived by using these three scales:
- Severity (S), which ranks the severity of the potential effect of the failure.
- Occurrence (O), which ranks the likelihood that the failure will occur.
- Detection (D), which ranks the likelihood that the problem will be detected before it reaches the end-user/customer.
- Ranking scales in the oil and gas industry usually range from 1 to 5, with higher numbers representing more severe risk. Other industries also use ranking from 1 through 10. After the rankings have been assigned, the RPN for each failure scenario is calculated by using this equation:
RPN = S x O x D
In regards to the Criticality analysis, analysts can assign quantities to a number of factors in order to quantify the aforementioned Criticality ranking. The process of quantifying the risk of individual failure modes is described below.
Let’s start by describing the modal failure rate. This is the fraction of the item’s total failure rate based on the probability of occurrence of that failure mode. The modal failure rate is given by the equation:
λm = α λp
Where:
- λm = the modal failure rate
- α = the probability of occurrence of the failure mode (failure mode ratio)
- λp = the item failure rate
With this information, the degree of importance can be extended to accommodate two important factors: conditional probability of the current failure mode’s failure effect and duration of applicable mission phase, as shown in this equation:
Cm = (λm β t)
Where:
- Cm = Failure mode criticality number
- β = Conditional probability of the current failure mode’s failure effect
- t = Duration of applicable mission phase (expressed in hours or operating cycles)
In essence, it is a mathematical means to provide a number in order to rank importance based on its failure rate.
One small caveat here – failure rates for redundant systems must be taken into account! Check DNV-RP-D102 for FMEA of Redundant Systems and TM 5-698-4 on page 4-10 for a better description.
Back to the plot – The sum of the modal failure rates for an item will equal the total item failure rate; provided that all item failure modes are accounted for. If there are three different failure modes, then all their failure rates (modal failure rates) will equal the item failure rate as shown below:
Cr = Σ(Cm)
Where:
- Cr = Item criticality number
- Cm = Failure mode criticality number
There are a number of reference standards that provide assistance in learning about FMEA/FMECAs:
- TM 5-698-4: Failure modes, effects and Criticality analysis (FMECA) for command, control, communications, computer, intelligence, surveillance, and reconnaissance (c4isr) facilities
- DNV’s Guideline for Execution of FMEA/FMECA
- DNV-RP-D102 FMEA of Redundant Systems and;
- DNV-RP-A203 Qualification of New Technology
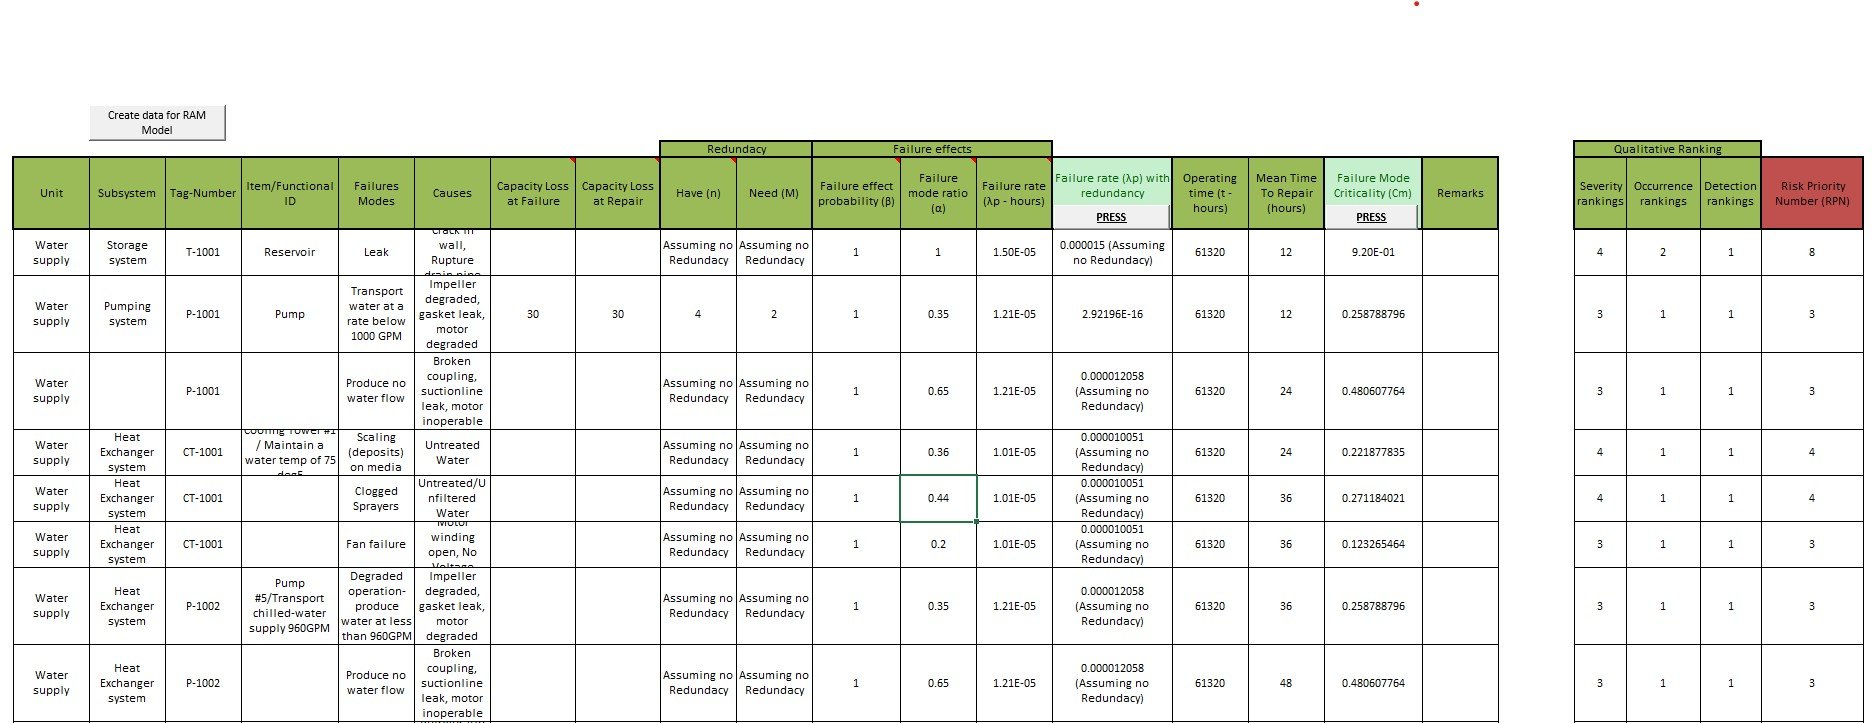
In these references, a number of different templates exist for FMEAs/FMECAs. These are great starting points that can be modified and customized as necessary. As an example, information was gathered from several references to build the following spreadsheet:

Example of FMEA/FMECA
While FMEA and FMECA identify important risks, its methodology does not lend to representing the full risk picture and therefore presents a few limitations:
- I believe one of the main problems is being able to quantify “how much” better or worse a certain failure mode is. Looking at the RPN scaling, having a failure mode with a rank of 10 does not necessarily mean this failure mode is 10 times worse than a failure mode ranked with 1. Simply looking at RPN scaling makes it difficult to determine which system best meets the desired design/risk criteria.
- Another problem with FMEA/FMECA is the inability to account for simultaneous failure events – so this limits the learning process to simple and singular event occurrences. This requirement is particularly important when looking at redundant systems with multiple equipment items or components (very common in the oil and gas industry).
- Finally, the perception that FMEAs/FMECAs get shelved probably put a lot of engineers off. Why would you spend weeks in workshops if that information it not going to be thoroughly used later on?
Taking everything that was mentioned above into account, results may not be as comprehensive as you would expect.
So this is exactly where Reliability, Availability and Maintainability (RAM) studies come to the rescue! The Maros and Taro Application Programming Interface (API) tool helps you transfer the information created in the FMEA/FMECA spreadsheets into a RAM model. So the knowledge acquired and value added throughout the workshops is retained and moved to the next step of the project.
Advanced RAM analysis combines the Monte Carlo method to simulation techniques – we have explained this combination a few times, you can refer to this post to learn a bit more about the importance: Production availability and capacities and Statistics and probabilities – The heart of RAM analysis.
The spreadsheet incorporate some VBA coding that can be extended to suit your needs (if you have feedback on something that is missing, please let me know). More importantly, one can use the FMEA/FMECA spreadsheet to automatically create a RAM model. All you need to do is press the button “Create data for RAM Model” and move to the next tab. Give it a quick check and press “Build RAM Model” – a Maros model will be automatically created!
With the RAM model, the valuable information acquired in the FMEA/FMECA is moved to the next stages of defining the overall risk picture. The simulation process will test many scenarios, for instance, when multiple and concurrent events are taken into account.
Small disclaimer: this spreadsheet is being offered free of charge so we cannot accept any liability on it. It would be nice to get people to work with us and improve it, in case you find any problems with it. In order to run it, you need to have a Maros 9 or above installed plus a Macro-enabled Excel.
Other references:
- Basic concepts of FMEA and FMECA from the great reference Weibull webpage
- MIL-STD-1629A: MIL–STD–1629A was cancelled without replacement in 1998, but nonetheless remains in wide use for military and space applications today.
- I also really enjoyed reading about FMEA/FMECA in the Warwick Manufacturing group: Product Excellence Using Six Sigma


