Bayesian network models – An engineer’s best friend
I wager that you are a Bayesian thinker! Yes, no, not sure? I am and, even if I have never met or talked with you, I’m certain that you are too. Let me explain why I am so confident about this and why Bayesian network models may be an engineer’s new best friend.
Bayesian thinking
Allow me to digress for a moment. I’m a rugby fan and I support the Glasgow Warriors team. This morning while having my breakfast I was thinking about how they might make out at the weekend and whether they would win or lose. I couldn’t recall who they were scheduled to play against but I know from the season so far, they have won six out of eight, or 75%, of their games. So, without knowing who they are going to play against, I had a good expectation as to their chances of winning. Then I discovered that they will be playing the current champions Leinster, and we don’t have a great track record against them, having won very few of our games against them in recent times. That dampens my optimism, so I view the chances of winning this upcoming weekend as being quite a bit less than my initial view of 75%. I read a little more and discover that we have only won one of ten matches at their stadium but have won six out of ten of the games played at our own stadium. When I discover that we will be playing at our home stadium, I am a bit more confident and up the chances of us winning. So, I end up with a somewhat more optimistic view on our chances of winning but I am not nearly as confident as I had been at the outset before I knew who we were going to play and the location.
Does this sound like a familiar thought process that you may go through? I can only imagine that you responded “yes.” If so, then you are a Bayesian thinker!
This is the fundamental concept of Bayesian modelling; we combine previous knowledge with observed state or new information to update our minds’ views of how likely something is to occur. This can be qualitative or quantitative in nature.
Understanding the “why”
In a previous blog post, I pondered the dilemma that engineers have in using data-driven analytics and the demands that they make upon these. Many data analytics solutions, including machine learning, are purely predictors. That is, they give an estimate of condition or simply a good/bad type answer but don’t explain the “why” behind the decision. Engineers are all about the “why.” Knowing that something is wrong or may go wrong is only the start of the problem. Understanding the “why” is fundamental to enabling effective decisions to be made to optimize and maintain the equipment that they are responsible for and prevent failures. I also said that Bayesian network models may well be an engineer’s new best friend. So, given that we just established that you and I are already Bayesian thinkers, how can we make more formal use of this in analyzing situations? Specifically, how do we manage physical assets such as pipelines? How can we utilize it to help us get to the “why” of a situation?
Let’s look at a very simple example to illustrate the Bayes theorem at work in a pipeline risk assessment application. I am assessing a segment of a pipeline and I want to know how likely it is that it may fail within some time span due to external corrosion. The actual numbers used here are not realistic in terms of magnitude, but I hope that it helps in understanding the concept a little more clearly. I know that segments in my pipeline have typically failed in 20% of occasions. Therefore, 20% (or 0.2) is my initial, or prior, belief on the probability that the segment I am evaluating will fail in my time period of interest. Now, I look up some history on the pipeline and discover that the cathodic protection system on that pipeline is ineffective. From my records I can also see that when there have been previous failures due to external corrosion where the cathodic protection system on the pipeline had been deemed ineffective on 60% of occasions. More generally I have been able to ascertain that the cathodic protection system is ineffective 30% of the time.
This gives me an estimate that the probability of my pipe segment failing is 0.4 (or 40%). This is quite different, a factor of 2 higher, than I would have expected without the insight to the current state of the cathodic protection system on my pipe segment of interest and an understanding of the relationship between cathodic protection state and historical failures.

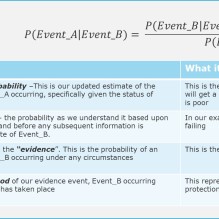
Figure 1: Bayes rule and its terminology
Figure 1 shows the general form for the Bayes rule in calculating probabilities. This provides an intuitive framework for the value of considering additional information or knowledge to improve our understanding of the probability of an event occurring.
Bayesian networks

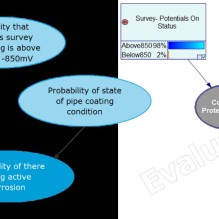
Figure 2: Right-hand side shows the factors considered in the model and the dependencies. The left-hand side shows an example with calculated probabilities. The result tells us that there is a 23% chance of active corrosion given our observations on the corrosion protection and coating condition. (Illustrative model only!)
Now, on to Bayesian networks, also known as probabilistic graph models, causal networks, belief networks. They are typically represented in graph form (formally called directed acyclic graphs, or DAG). This starts to make them more readily understood and enables us to visualize dependence and relationships between cause and effect in systems that we model. To illustrate, let’s look at a hypothetical example model for assessing whether we have active corrosion on a pipe segment. We know that the conditions for active corrosion are that there is poor cathodic protection and that there is coating damage. We can write this out in the form:
This, in words, is saying that we are calculating the probability of there being active corrosion given what we have observed on the condition of the pipe coating and the state of the cathodic protection on the pipeline. We are also aware that the level of protection depends on the levels of the “on” and “off” potentials from our close interval survey. We can represent this in a graph form as shown in Figure 2.
Of course, real-world models get much more complex and messier to view but they are a step towards being able to better understand the structure and behavior of relationships and what may be driving decisions made from data observations.
The probability distributions we use to represent each part of the model will be updated as more data is observed, and this is the crux of the value and strength of Bayesian inference. Bayesian updating, which this is known as, is precisely what I was doing when I altered my views on the chances of Glasgow Warriors winning first given who they would play against and again when I knew match’s location. Likewise, for our simple corrosion model we will learn from operational observations to update and “refine” the relationships between the on/off potential readings and the probability of having adequate protection. Additionally, we update our belief on the chances of active corrosion given the status of coating condition and corrosion protection level.
Bayesian network models in the advancement of pipeline analytics
Hopefully this introduces the basics of how Bayesian network models can be used and how they are a natural way to formulate many decision processes that we face in everyday life as well as in engineering. As an example of how we at DNV are using Bayesian network models, you can take a look at the work of my colleagues in the Oil & Gas business area who have developed the pipeline risk analysis and visualization tool MARV. Read more about it in the publication from the California Energy Commission. Bayesian network models and principles are also being evaluated and utilized in the advancement of our pipeline analytics within the DNV Pipeline Ecosystem products. For example see an earlier post on modelling uncertainty in pipeline leak detection.
Next up, we will be looking deeper at how we can best get a handle on determining causation from models and the value brought to engineering analytics by the likes of Judea Pearl and the “do-calculus” concept.
Author: Tom Gilmour
10/21/2021 11:52:22 AM
