Windiness 2022
A geospatial overview of wind resource – what are the implications for you?
What do the 2022 results mean for you?
Following the wind speed analysis undertaken for the UK and Ireland, we have assessed the ‘windiness’ for various regions around the globe. We are using a common long-term reference period between 1996-2021 to assess the wind resource in 2022 for consistency across each region. It is noted that for a more thorough assessment at a country-level, the consistency of the data making up the index for each country should be investigated.
Below we present the Annual Windiness Indices for these regions, which represent the wind speed snapshot of 2022 against the long-term mean wind speed.
North Sea (Benelux, Scandinavia & Baltics) wind speed trends
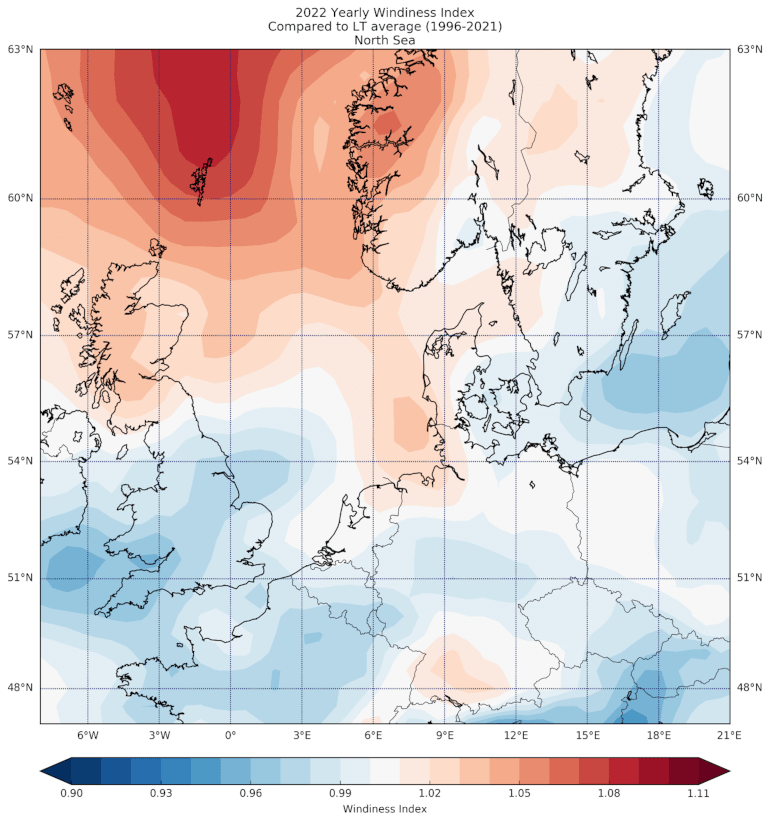
Located north of the United Kingdom and west of Norway, a strong pattern shows that the wind speeds in 2022 were higher for this area compared to that of its respective long-term mean wind speeds. The indices are suggesting that the area above the Shetland Islands has had winds 9% stronger than the average. Additionally, the Fjordkysten regional park area experienced 6%-7% higher than average windiness.
The remaining areas in the North Sea have shown a consistent trend of windiness with areas that are above and below the long-term average by about 2%. A weaker pattern is present off the east coast of the UK that shows windiness has dipped by 2%-3%.
The higher-than-average windiness trends in the North Sea could be a result of the warmer than usual temperatures recorded for the year 2022 in these areas. The warmer temperatures result in the sea being warmer, which results in stronger winds.
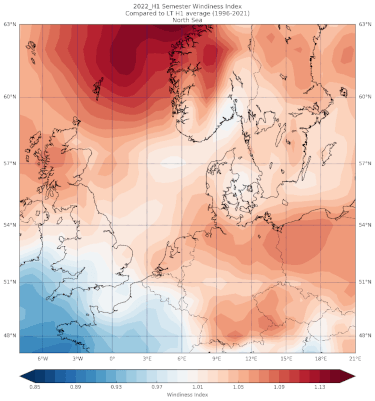
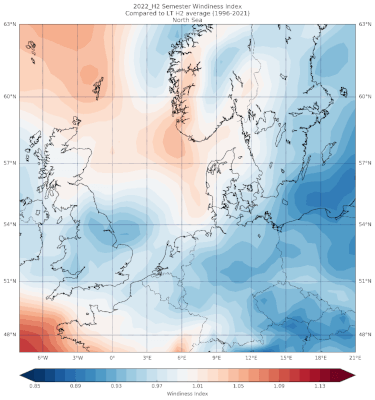
These anomalies are not consistent throughout the year with the first half of the year showing strong winds in every region. The two major anomalies can be seen in the first half of the year with peaks of 12%-13% higher. The second half shows weaker trends in Norway, Denmark, Benelux and along the west coast of the UK when compared to the first half. There are trends of high winds reported near the south of Norway and the Shetland Island but with peaks of 5%. This suggests that the temperatures were higher going into the summer months.
|
|
Southern Europe wind speed trends
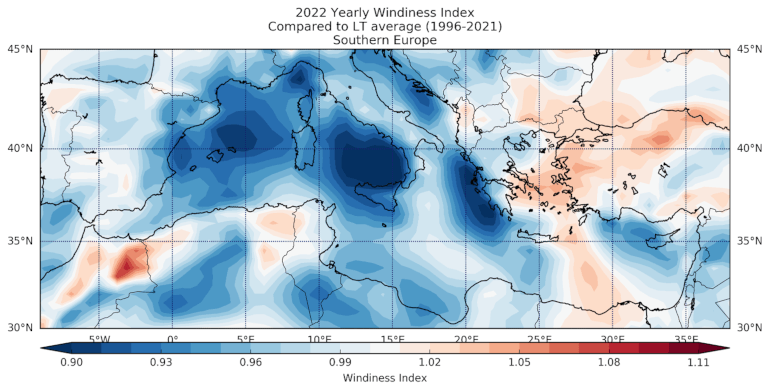
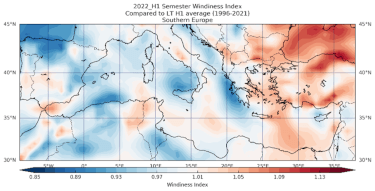
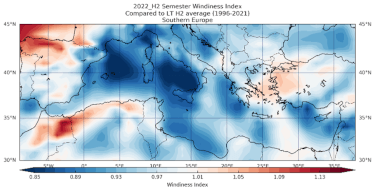
The windiness trends in Southern Europe have been lower than average. Namely, areas along the west coast of Spain, the Tyrrhenian Sea, the Adriatic Sea and the east coast of Greece have experienced weak wind conditions with all these areas recording at least 8% lower than average. Conversely, areas in mainland Turkey and the Aegean Sea have seen windiness trends with peaks of 5% above the long-term average. These trends are especially evident when looking at the windiness in the second half of 2022 where almost all regions surrounding the Mediterranean Sea showed lower windiness trends.
|
|
Middle East (Near East and Arabian Peninsula) wind speed trends
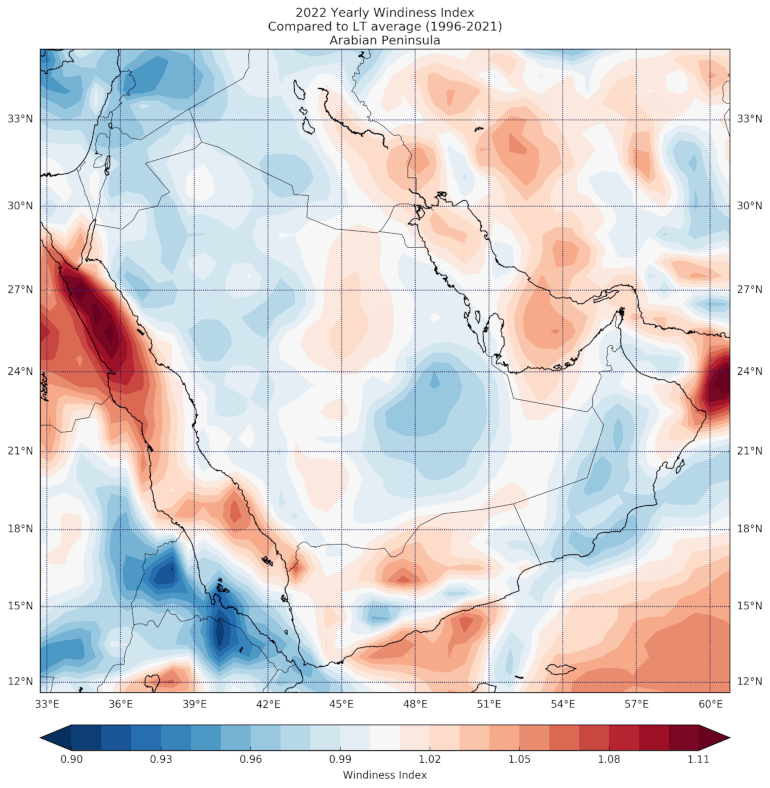
The windiness associated with the Arabian Peninsula is consistent with 2021 trends, with two strong wind trends located in the Red Sea and the Gulf of Oman. These areas showed wind speeds at least 11% stronger than normal.
Across Saudi Arabia, localized areas were also observed to have peaks of 5% and dips of 4% compared to the long-term average. Yemen’s windiness trend for 2022 shows that both onshore and offshore index values of 5% above the normal.
Africa wind speed trends
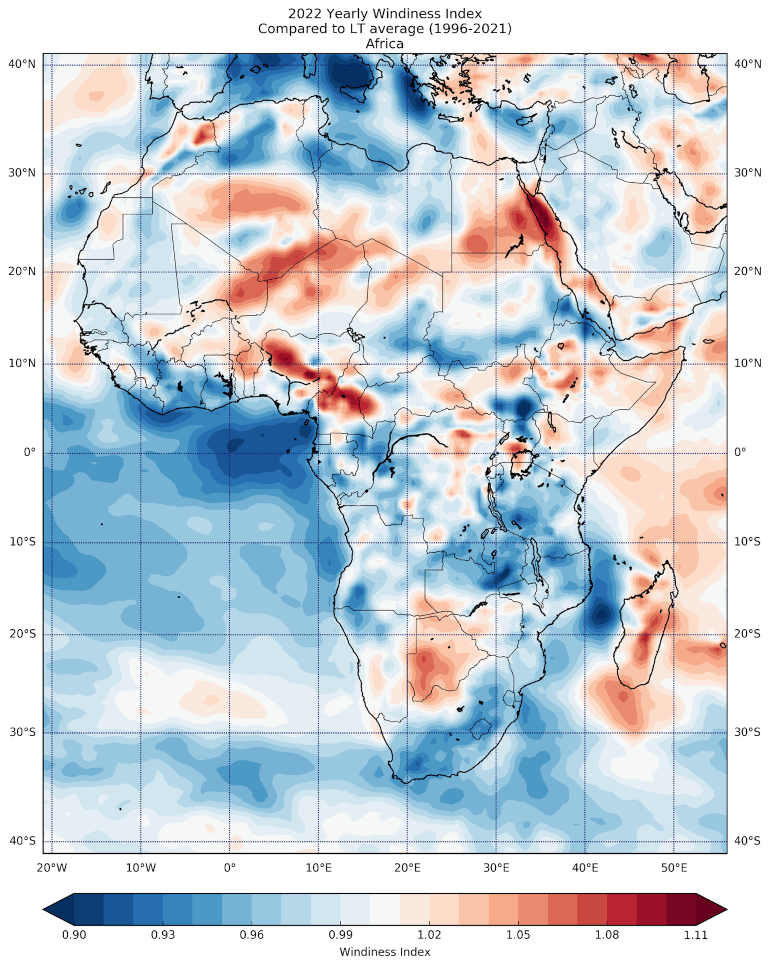
Africa generally experiences normal wind speed trends around the equatorial countries due to the general atmospheric circulation and the Easterly winds. While in its Northern and Southern regions, Westerly winds are usually predominant. In most parts of Africa, trade winds are responsible for constant high surface mean speeds of 10 m/s which make the region very suitable for wind energy developments. In this section, we will look at the African countries where large wind farms are already in operation, such as Kenya, South Africa, Morocco, and Egypt.
Kenya, one of Africa’s equatorial countries is blessed with constant high wind speeds across the year and is host to the continents largest wind farm, the 310 MW Lake Turkana project that sits in the northern part of Kenya. This region experienced higher than average winds. However, the rest of the country was not so lucky, recording mostly lower than average wind speeds.
Morocco experienced a close to average wind speed year. Southern and Eastern parts of Egypt also saw a higher-than-average wind speed year, with a particularly high index apparent in the Red Sea and extending back onto the Eastern coast of Egypt.
South Africa wind speed trends
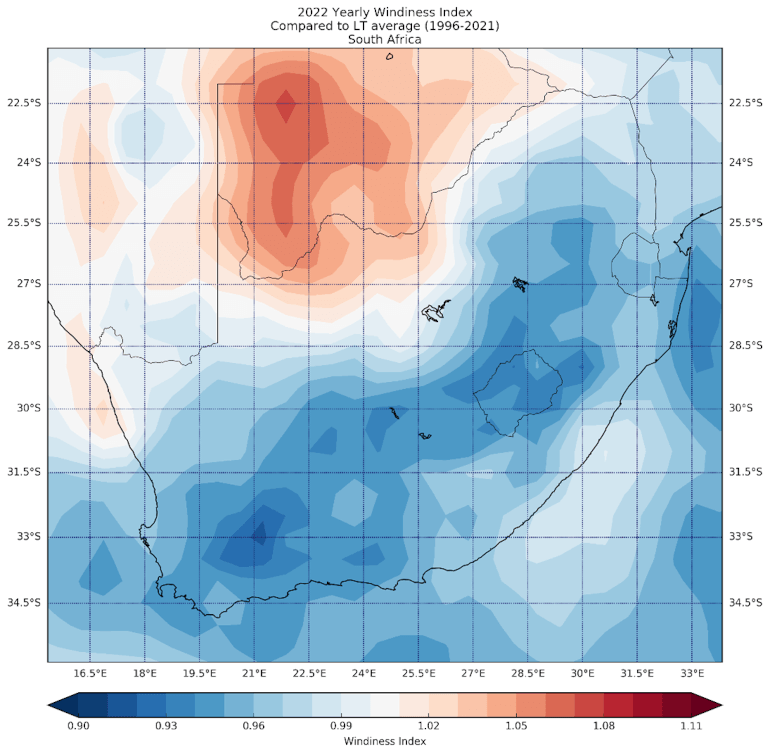
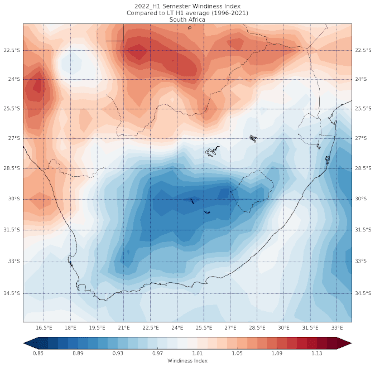
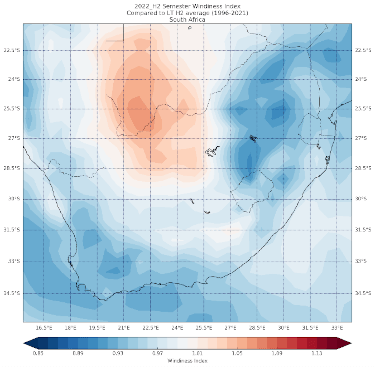
2022 was a tough year for the 35+ wind farms in South Africa, seeing average wind speeds as low as 9% compared to the long-term average. The first half of the year had exceptionally low wind speeds. During the second half of the year, wind speeds picked up a little bit, bringing the wind speed deficit to 3 to 5%.
|
|
North America wind speed trends
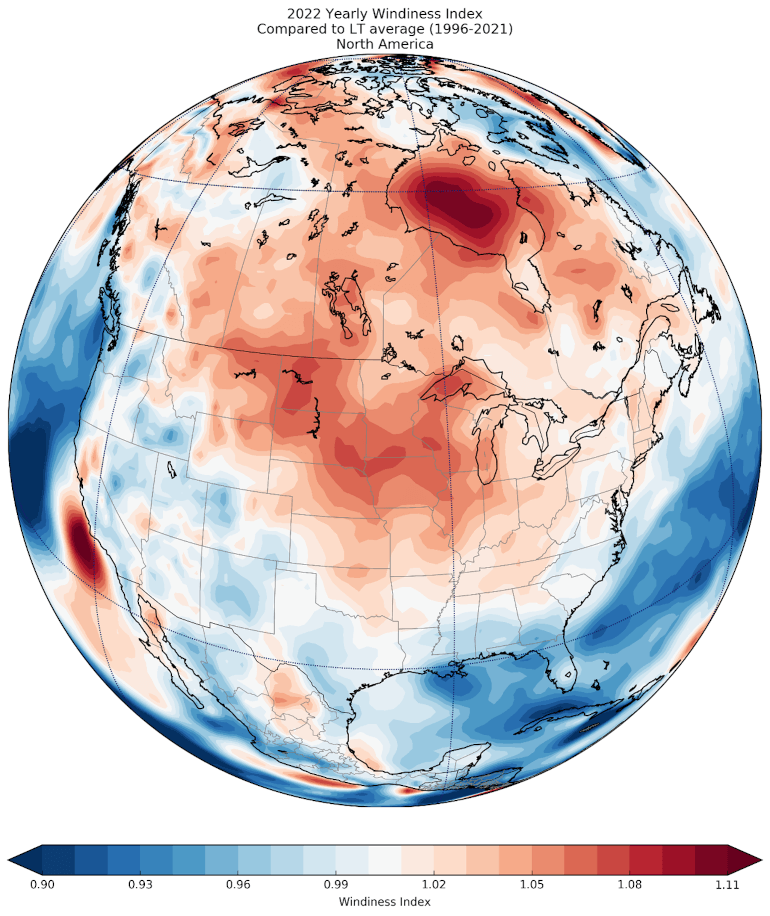
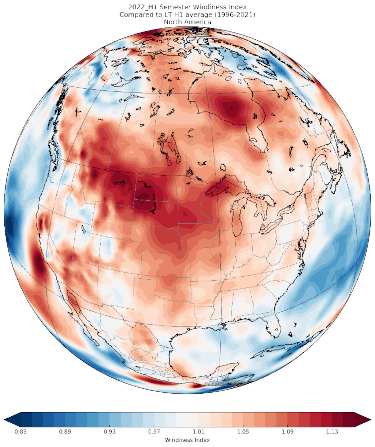
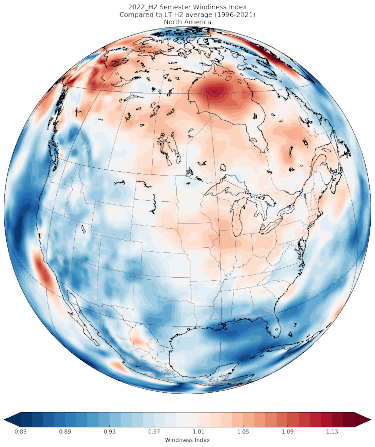
The windiness in Canada has been above average with peaks of 11% in Hudson Bay. High wind trends of 7% have also been observed in southern Alberta where an estimated potential of 700 MWh of new wind farms are currently in development. The east and west coast of Canada showed similar tendencies where windiness did not go higher or lower than 2% around of the average.
The United States showed a localized pattern with centres around North Dakota, South Dakota, Iowa, and Wisconsin. The east and west coast showed very little deviation from the long-term average.
Between the first and second half of the year, all the strong windiness areas except for Hudson Bay have shown a trend of a strong first half and weak second half of the year. This can suggest that the windiness patterns in Hudson Bay are more consistent and potentially could be a viable option for future instalments of wind farms.
|
|
Central and South America wind speed trends
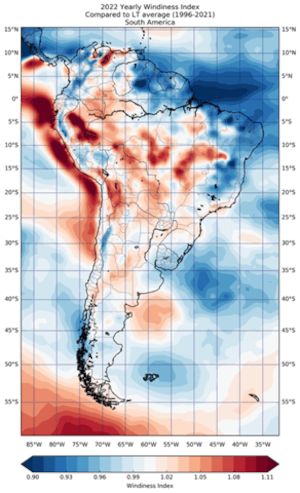
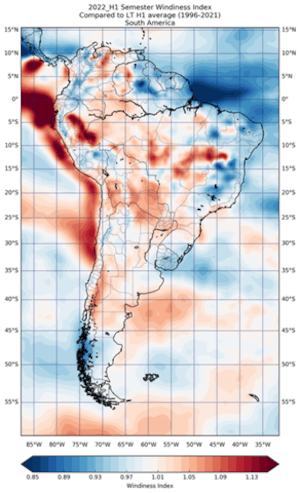
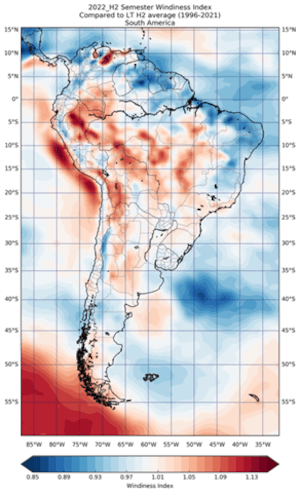
In general, this region saw a mixed picture, with most areas experiencing below average wind speeds but certain niche locations exhibiting strongly the opposite effect.
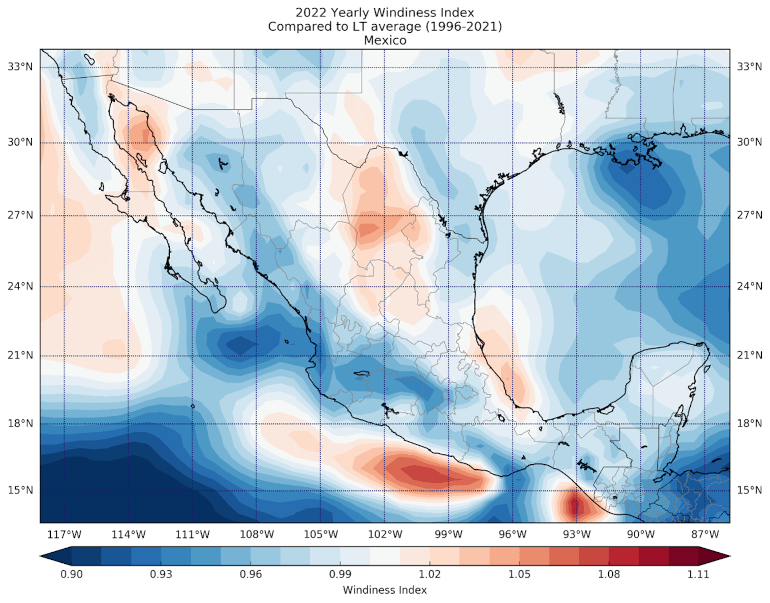
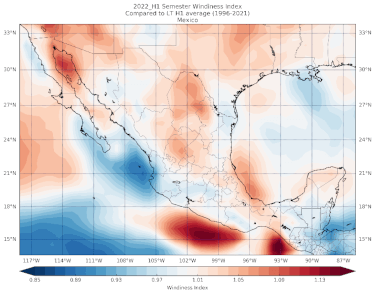
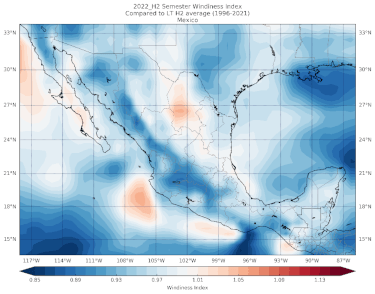
Mexico saw low wind speeds during the year. A strong first half of the year might have brought an optimistic outlook for wind farm owners; however, an abnormally low second half of the year with a 5 to 7% decrease in wind speed from the long-term average may have presented some challenges. Some regions however, such as Nuevo Leon where the El Mezquite’s 252 MW project is located, experienced mostly good winds all year long.
|
|
Uncharacteristically slow wind speeds were recorded in Brazil in 2022. Unfortunately, most wind farms in Brazil are concentrated in the east, where wind speeds were recorded as low as 10% below the long-term average. On the other hand, winds along the coast from Northern Chile to Peru and Ecuador were up to 13% stronger than the long-term average. Moving up to Colombia, specifically along the Caribbean coast we saw low winds consistently throughout the year. Winds picked up near the Amazon region and for Venezuela as well.
Argentina’s Pampeana region saw very average wind conditions for the year. However, Argentina's border with Bolivia and Paraguay had intense winds all year long, averaging between 5 and 8% stronger than the expected long-term average.
|
|
DNV's Wind Index
DNV maintains multiple Wind Indexes for various countries and regions, which enables investors and owners to assess the performance of potential or operating projects. Likewise, the Wind Index is a robust tool for wind farm developers, empowering them to understand the ‘windiness’ of their wind monitoring campaigns compared to a long-term period.
The long-term reference period represents all years between 1996 and the year prior to the analysis. The Wind Index is normalized so that the average wind speed over the long-term period is 100%. The windiness of any given period is expressed as a percentage of the long-term average wind speed. Thus, a value exceeding 100% (or 1) indicates that a period was windier than the long-term average, whilst a value below 100% (or 1) suggests that a period was less windy.
About DNV
DNV offers a new service for generating bespoke monthly Windiness Reports for your portfolio. This includes an average of your entire portfolio and a breakdown of each one of your assets. For more information, please contact Doireann Kavanagh. Learn more about our full range of services and products.
3/7/2023 8:00:00 AM
