Windiness 2021: A geospatial overview of wind resource – what are the implications for you?
What do the 2021 results mean for you?
Following the wind speed analysis undertaken for the UK and Ireland, we have assessed the ‘windiness’ for the North Sea (Benelux, Scandinavia & Baltics), Africa, Middle East (Near East & Arabian Peninsula) and Southern Europe regions. We are using a common long-term reference period between 2000-2020 to assess the wind resource in 2021 for consistency across each region. It is noted that for a more thorough assessment at a country-level, the consistency of the data making up the index for each country should be investigated.
Below we present the Annual Windiness Indices for these regions, which represent the wind speed snapshot of 2021 against the long-term mean wind speed.
North Sea (Benelux, Scandinavia & Baltics) wind speed trends
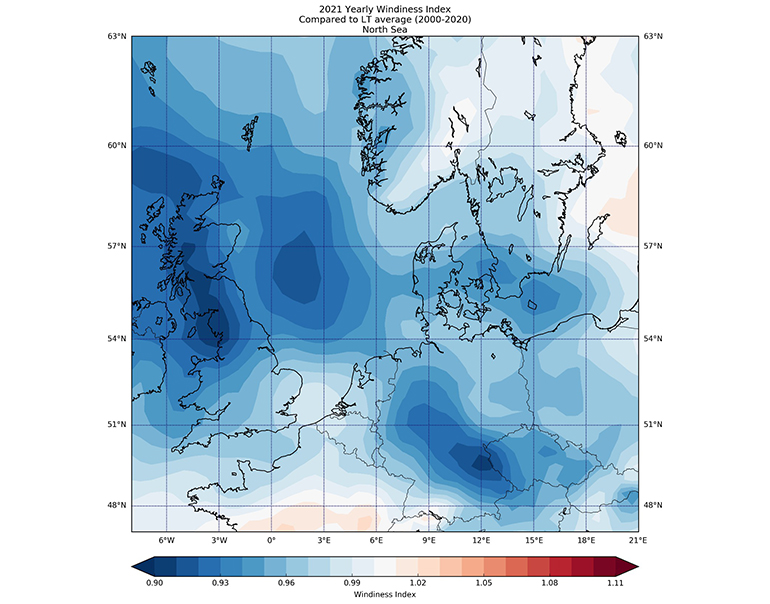
A very distinct pattern of low wind speeds can be observed in the North Sea resulting in indices around 90% which means it’s 10% weaker than the respective long-term mean wind speed. This low wind regime is less evident at the Strait of Dover where a windiness of nearly 100% had been recorded. But more profound than that, Dogger Bank and Fladen Ground were lower and achieved 90%.
On average, all countries in the North Sea and Scandinavia recorded much lower wind speeds than usual with the UK and Central-East Germany demonstrating areas with very low windiness.
Wind speeds in Benelux were also weaker across the entire region in 2021 with a distinct pattern of higher anomalies in the North-Western parts which dissipated when moving South-Eastwards. Eastern parts of the Benelux region recorded an index of 96-97% which meant a 3-4% decrease in mean annual wind speeds. The Netherlands also experienced a less windy year than usual with a distinct geographical distribution that showed decreased wind resource in the Northern parts of the country.
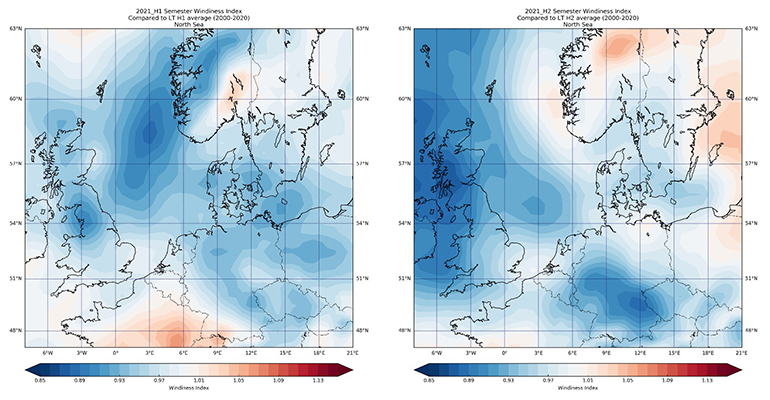
This negative divergence from long-term averages can be mainly attributed to a very weak second and third quarter of the year when wind resource exhibited record drops in wind speeds of 22% for the UK and Ireland. There are two centres of low wind speed anomalies observed in the North Sea and UK during the first half of the year. But in the second half of the year, these centres shifted to the southwest in both cases. Another centre of low wind speeds can also be seen in Germany during the second half of 2021.
Southern Europe wind speed trends
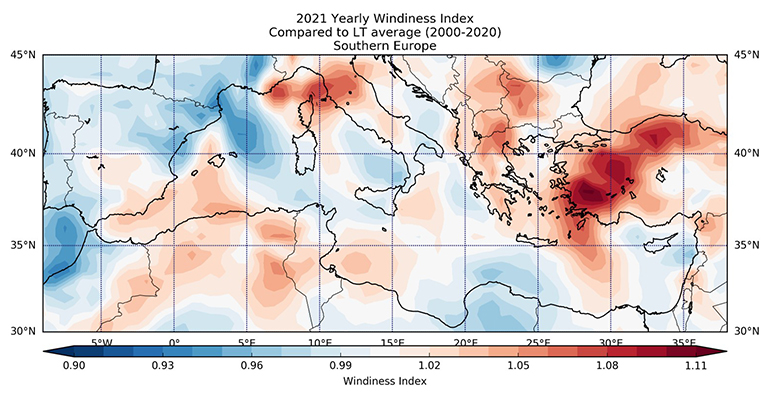
Windiness in Southern Europe fluctuates from West to East. Turkey recorded wind speeds 12% higher than usual across most of its territory while Greece and the Aegean Sea also observed wind speeds higher than usual. Italy had a year within long-term expectations except for the area around Corsica. Spain and Portugal observed nearly normal or slightly lower than usual wind speeds during the year too.
Middle East (Near East and Arabian Peninsula) wind speed trends
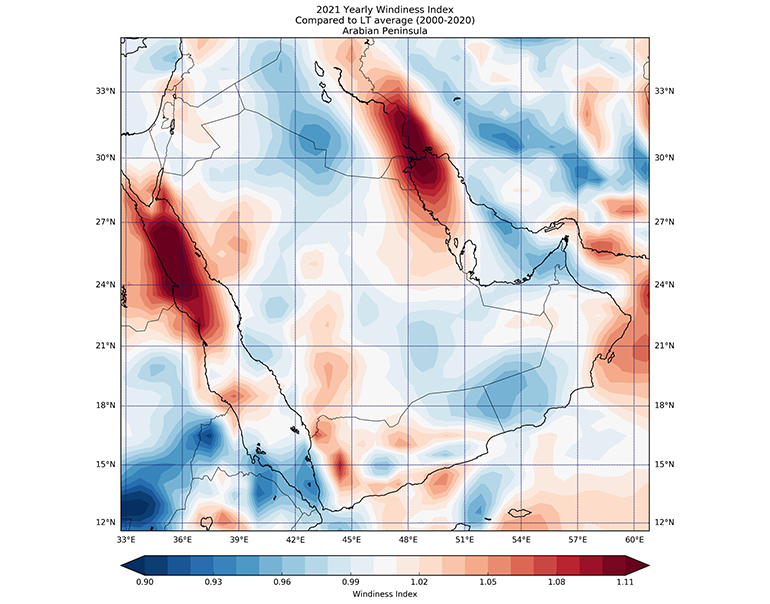
There was a completely different story in this part of the world where wind speeds followed a rather normal trend across 2021. Extreme deviations on the positive side can be observed at the Red Sea and the Persian Gulf with at least 12% stronger wind speeds.
Almost all countries exhibited very similar wind patterns during both halves of 2021 with the centres of high wind speeds being evident during the entire year. Lebanon, Israel, Jordan, and the UAE observed almost normal wind speeds during the year without any significant anomalies.
Africa wind speed trends
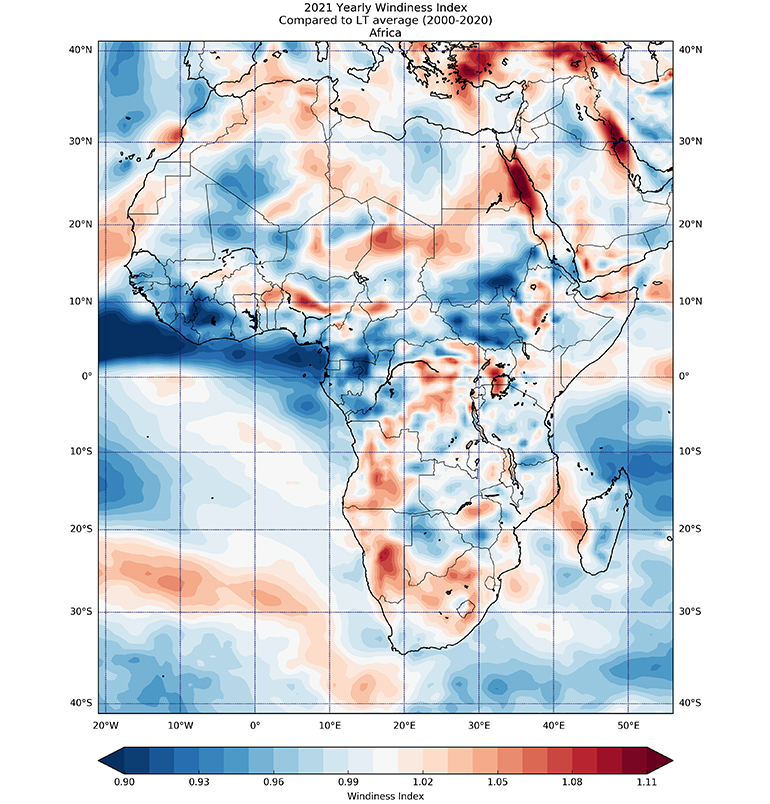
Africa generally experiences normal wind speed trends around the equatorial countries due to the general atmospheric circulation and the Easterly winds. While in its Northern and Southern regions, Westerly winds are usually predominant, in most parts of Africa, Trade winds are responsible for constant high surface mean speeds of 10 m/s which make the region very suitable for wind energy developments. In this section, we will look at the African countries where large wind farms are already in operation, such as Kenya, South Africa, Morocco, and Egypt.
Kenya, one of the African equatorial countries is blessed with constant high wind speeds across the year and is host to the largest wind farm in Africa, the 310 MW Lake Turkana project. However, annual mean wind speeds in Kenya were slightly lower than the long-term reference mean, and in the range of minus 1-3%. Winds were weaker during both halves of the year, so naturally the wind farms in the regions were expected to generate lower energy than normal expectations.
On the other hand, South Africa recorded higher wind speeds during each half of the year where most wind farms were operating with Annual Indices around of between -4% to +10%.
Morocco experienced, in general, a lower-than-average wind speed year, with the exception of locations near the Algerian border to the East and a wind “hotspot” on the western coast, just north of the 30° parallel. Finally, the Southern and Eastern parts of Egypt also saw a higher-than-average wind speed year, with a particularly high index apparent somewhere in the Red Sea and extending back onto the Eastern coast of Egypt.
DNV's Wind Index
DNV maintains multiple Wind Indexes for various countries and regions, which enables investors and owners to assess the performance of potential or operating projects. Likewise, the Wind Index is a robust tool for wind farm developers, empowering them to understand the ‘windiness’ of their wind monitoring campaigns compared to a long-term period.
The long-term reference period represents all years between 2000 and the year prior to the analysis. The Wind Index is normalized so that the average wind speed over the long-term period is 100%. The windiness of any given period is expressed as a percentage of the long-term average wind speed. Thus, a value exceeding 100% (or 1) indicates that a period was windier than the long-term average, whilst a value below 100% (or 1) suggests that a period was less windy.
About DNV
DNV offers a new service for generating bespoke monthly Windiness Reports for your portfolio. This includes an average of your entire portfolio and a breakdown of each one of your assets. For more information, please contact Ioannis Agiol.
Learn more about our full range of services and products.
4/20/2022 9:00:00 AM
