Windiness 2023
A geospatial overview of wind resource – what are the implications for you?

What do the 2023 results mean for you?
Following the wind speed analysis undertaken for the UK and Ireland, we have assessed the ‘windiness’ for various regions around the globe. We are using a common long-term reference period between 1996-2022 to assess the wind resource in 2023 for consistency across each region. It is noted that for a more thorough assessment at a country-level, the consistency of the data making up the index for each country should be investigated.
Below we present the Annual Windiness Indices for these regions, which represent the wind speed snapshot of 2023 against the long-term mean wind speed.
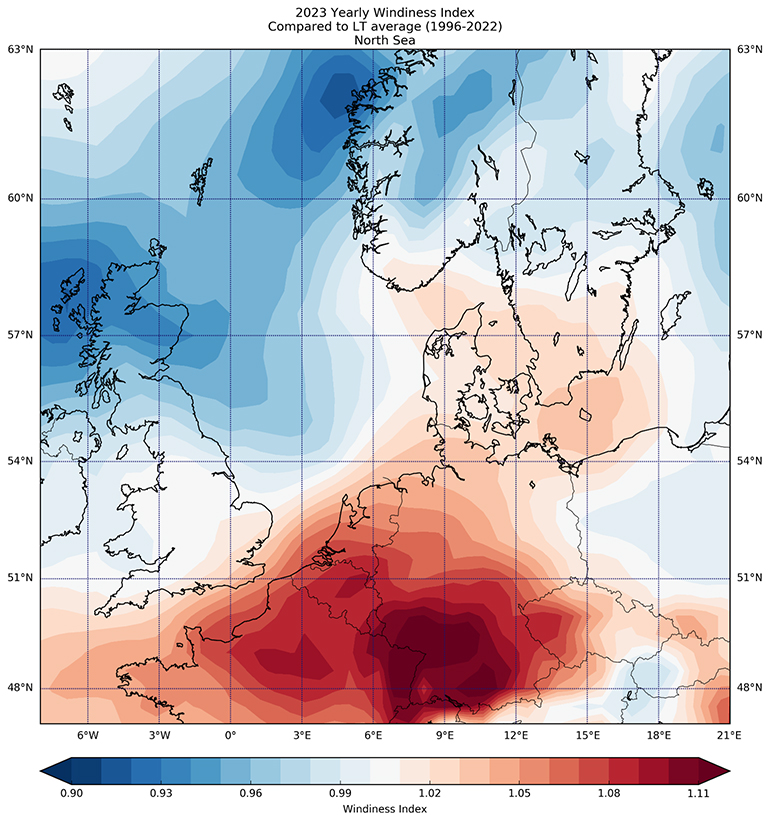
North Sea (Benelux, Scandinavia and Baltics) wind speed trends
Wind trends have seemingly switched completely compared to last year’s patterns in the North Sea area. West of the Fjordkysten regional park, the trends have declined by about 8 - 9%. On the west coast of northern Scotland, the wind trends have also declined by 7%.
Trends in northern Europe and southern Scandinavia remain close to the average with some areas reaching 2 - 4% above the average. Wind trends in southern Germany and northeast France have been significantly higher with index values reaching 11% higher than the average in the area. This is consistent with the record high wind events that have been observed and reported in these areas especially in the fall of 2023.
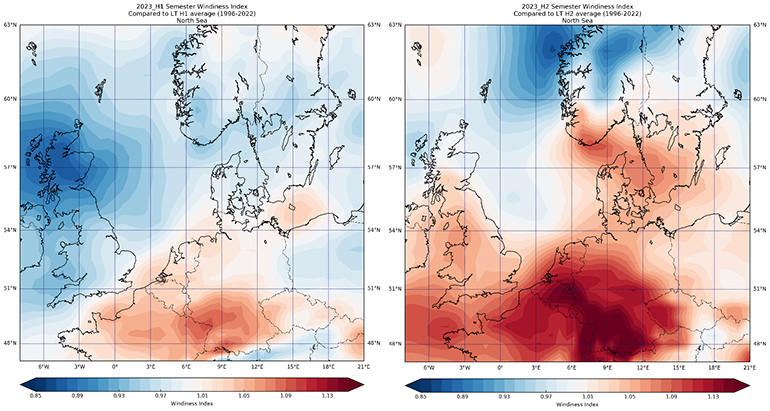
Comparing the windiness in the first half of the year to the second, major differences in trends can be seen. The low windiness trends off the coast of Scotland and Norway happen in the first and second halves of the year respectively. The second half of the year reveals the windiness index to be closer to the average for Scotland.
The high wind trends in southern Germany are present in both halves of the year but with significantly differing magnitudes. The second half of the year shows a larger area of high windiness which covers areas in southern Germany, northern France, Belgium as well as the Netherlands.
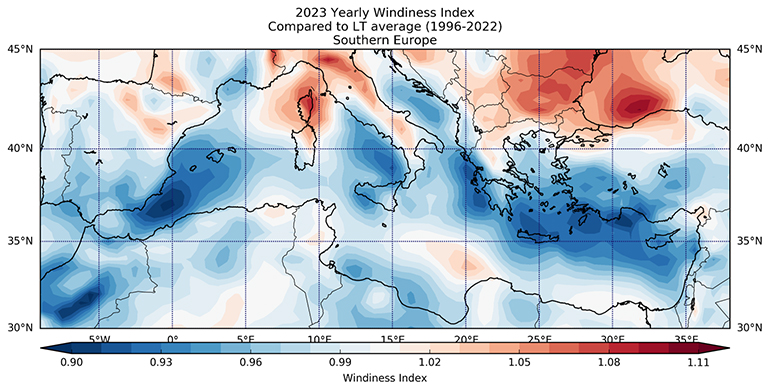
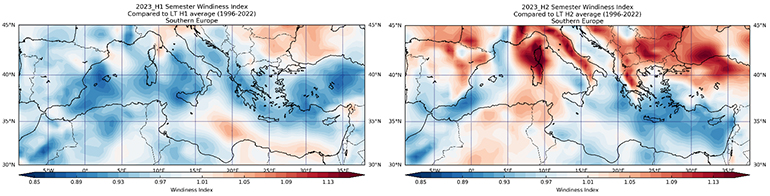
Southern Europe wind speed trends
Windiness trends in Southern Europe illustrate an overall trend of higher wind on land and lower trends offshore. The Mediterranean coast of Spain, southern Italy, Greece, and Turkey indicate wind trends to be about 8 - 9% lower than average. Corsica, Italy, Bulgaria, and Romania exhibit higher than average wind values of about 6 - 8%. A concentrated area with index values peaking at 9% higher than average can also be identified in the Black Sea, north of Turkey.
When comparing the wind trends from the first half of the year to the second, a clear pattern of higher wind trends can be seen in the second half compared to the first half. Consistent with reports of high wind events in northern Europe, these wind events were reported to be more abundant in the fall of 2023 and impacts windiness which drove values to be 15% higher than normal.
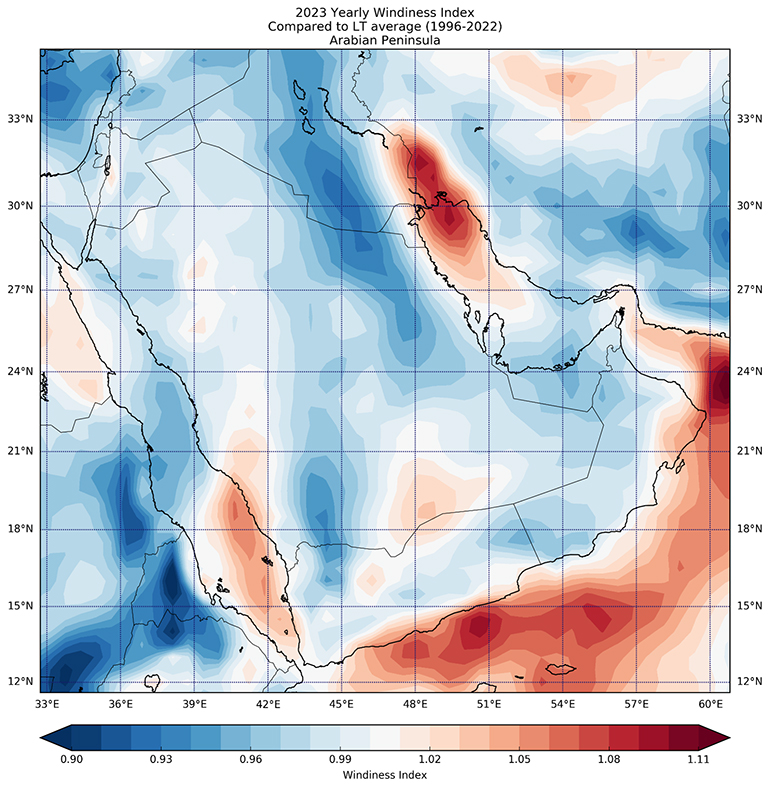
Middle East (Near East and Arabian Peninsula) wind speed trends
The Middle East experienced lower windiness trends on land and higher wind trends offshore. The northeast of Saudi Arabia and southeast of Iraq display a reduction of windiness of about 7%. The surrounding coast of the Arabian Peninsula show higher index values of about 7 - 8%.
Just east of Oman, a concentration of higher-than-average wind trends with index values 11% higher than average can be identified offshore. A similar concentration can be seen in the Persian Gulf with index values 9% above average.
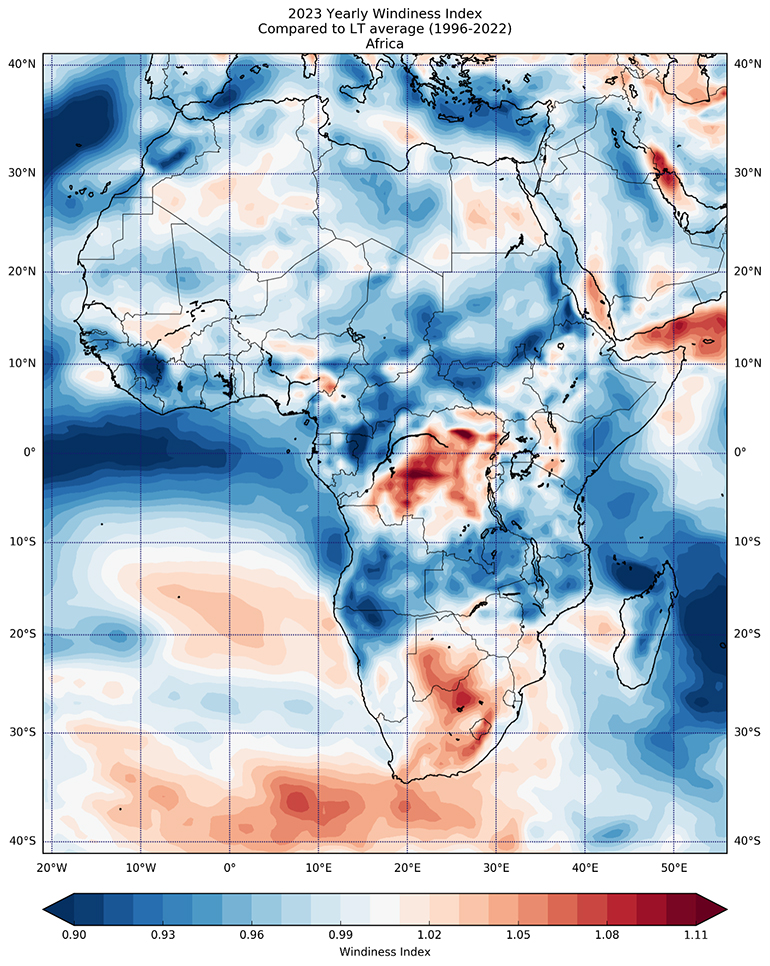
Africa wind speed trends
Africa generally experiences normal wind speed trends around the equatorial countries due to the general atmospheric circulation and the Easterly winds. While in its Northern and Southern regions, Westerly winds are usually predominant. In most parts of Africa, trade winds are responsible for constant high surface mean speeds of 10 m/s which make the region very suitable for wind energy developments.
East African countries are experiencing significant growth in the wind energy market as countries continue to diversify their energy mix. Kenya is one of the larger producers of wind energy with wind farms like Lake Turkana (310 MW) and Kipeto (102 MW).
Fortunately for both farms, they were on the narrow strip on Kenya which had a windiness index greater than one, leading to a potentially higher than anticipate AEP.
Morocco experienced a poor year when compared to the long-term average. Egypt experienced a close to average year slightly leaning towards a higher wind speed average.