What are the differences between Maros and Taro?

What are the main differences between Maros and Taro? The main differences are mainly on a block flow diagram level – What does this exactly mean? (This applies to Maros 9 and Taro 5)
Development of Maros was started in 1984 with a discrete event based simulation tool initially for the oil and gas industry for DOS and UNIX operating systems. In the mid 90’s the need for more downstream specific features resulted in the spin-off of Taro where more flexible block flow diagram, inherently needed for downstream processes, were possible to set up. Maros and Taro have been under continuous development since then.
From then onward the tools have been developed along different lines into separate simulation engines. The simulation engine for the two tools has been recently re-merged to allow features to be developed for a common platform plus moving features between the different applications.
A lot of the graphical user interface (GUI) is the same between the two tools, as well as many basic components of the simulation e.g. the reliability block-diagramming (RBD) with failure modes, scheduled activities and conditional element. The main differences are mainly on a block flow diagram level where Maros model focuses on a upstream process which typically involve separation processes and Taro model focuses on a downstream process where more flexible block flow diagram with diverging flow is required.
This can be difficult to grasp for a new user, which is why this document attempts to outline some differences.
Stated purpose
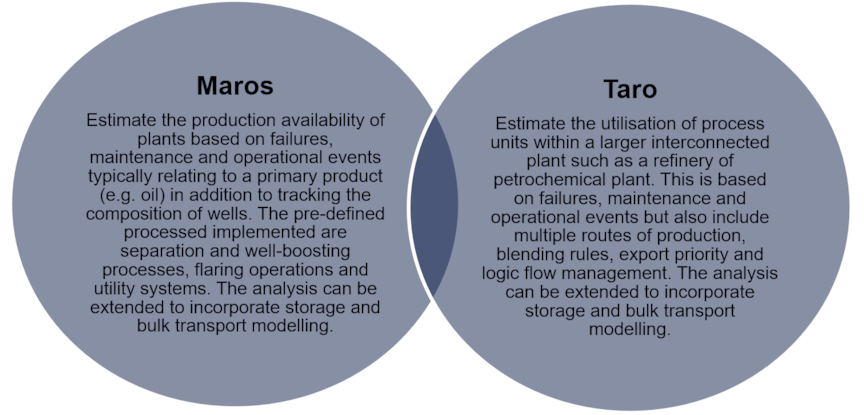
The stated purpose and direction for the tools can be summarised as follows:
Problems to solve
To exemplify the features and benefits when using Maros and Taro, a table is presented with different types of problems that users want to solve or essential process aspects needed to be considered.
| Problem to solve / asset types to look at | Maros | Taro |
| Upstream separation | Yes, possible to accurately track stream compositions throughout flow network. | Yes, but downstream processes are typically defined with yields which means that one is inherently unable to track products i.e. new components are created throughout the network |
| Downstream processes | Yes, but with a simpler approach; Process yields can be defined in the production profile. Typically, unit level analysis can be carried out but, when integrating the units in a system-wide model, where a more flexible flow network is required, Taro is more suited. | Yes, the flexible flow network allows the definition of complex block flow diagrams with Process yields multiple production routes, recycling and re-routing. |
| Blaming method | Because of the typical block flow diagram used to represent upstream processes, the blaming method can be used to identify and rank contributors to production losses for a specific criticality node. | Blaming method in Taro is reported at the unit level. The standard block flow diagram used to represent downstream processes typically is divergent with re-routing capabilities. This means e.g. that if one node is down due to a failure, the flow can be re-routed and may actually end up producing more than it would have otherwise. In Taro it is still possible to get a criticality ranking of the units in the system by isolating the impact of a specific node by disabling all other nodes. |
| Process yields | Process Yields can be defined as part of the production profile for a simple unit level analysis | Process Yields can be defined for each node |
| Reliability of support systems e.g. power and catalyst | Yes, simplistic approach with Reliability Block Diagram relating to main flow. | Yes, advanced approach where the actual flow of e.g. catalyst, steam, electricity can be modelled and the impact can be based on that flow rate. |
| Predict contractual shortfalls over life by modelling security of supply | Yes, possible to set up demand profile for multiple export nodes. | Yes, possible to set up demand profiles on any node in the network. |
| Bottlenecks in a network | Each node capacity is validated against the production profile for all product streams and mixtures. | Bottlenecks (nodes with capacity below the potential flow) are allowed in the network. |
| Analyse flaring restrictions and track total volume flared | Yes, it tracks multiple flaring operations with the option to set volume, time and potential of gas product constraints. | Yes, but no constraints are available (yet) |
| Changes in production or feed flow rates/quality must be accounted for | Yes, up to ten product streams in total, time varying rates of each can be defined. Composition is tracked along the flow network. |
Yes, unlimited number of streams and time varying flow rate. To model different flow qualities e.g. different ore grades over time, nodes phasing in and out can be used. |
| Analysing systems with refining into multiple products or processes with multiple additives | Yes, unit level analysis can be carried out but when integrating the units in a system-wide model where a more flexible flow network is required ideally one would move to Taro | Yes, the flexible flow network allows the definition of complex block flow diagram with multiple production routes, recycling and re-routing. |
| Assess recovery mechanisms in place and their effect on overall production | Yes, network boosting can be defined as the difference between potential and demand or directly controlled via boosting rates. Gas banks (line packing) and intermediate storage can be accounted for. Basic re-routing can be modelled. |
Yes, network boosting is defined locally per node which gives the ability to model a large range of scenarios. The boosting depends on network configuration, node capacities and local demand in addition recycle loops and advanced re-routing is available. |
| Seasonal behaviour | Yes, seasonal repair distributions and transients on most elements, such as failure mode data or capital expenditure, make this possible. Production profiles allow commissioning/de-commissioning of wells to account their transient behaviour. |
Yes, seasonal repair distributions and transients on most elements, such as failure mode data or capital expenditure, make this possible. Nodes phasing in and out provides endless possibilities for changing behaviours over time. |
| Common cause failures and complex logic | Yes, using conditional elements in the Reliability Block Diagram | |
| Maintenance constraints modelling (spare part optimisation, resource availability analysis) | Yes, Maros and Taro dynamically tracks maintenance resources throughout system life. | |
| Quantification of impact of various logistic options | Yes, Maros and Taro uses an advanced approach with closed fleet modelling accounting for size, number, travel distances, tanker delays, annual delivery plans, bottlenecking at berth etc. | |
| Cost/benefit analysis of different design options | Yes, in Maros and Taro CAPEX, OPEX and product value considered. Alternative designs and operational strategies are easily evaluated. | |
| Animation mode | Yes, replay mode available to see the impact on flow over time at top level for individual life cycles. | |
| Unit utilization results | Yes, unit utilisation is a number that summarises the achieved performance of the unit considered as part of the network. It is measured against the node capacity. | |
| Storage sizing for feed tanks, intermediate tanks or product storage. | Yes, Maros and Taro allows for complex storage configurations with level management operations and flexible flow control. | |
| External Connections | It is possible to export most data and import almost all data inside the software. It is also possible to control the building of models via Visual Basic scripts by using Maros and Taro API. |
Differences in the flow with example
For a more detailed overview of how the flows are different in Maros and Taro, please follow the two examples bellow.
Maros – Block flow diagram
This example shows a flow network where two wells feed into a separation process. The wells have time varying flow of three products – oil, gas and water – over three years time. The separator feeds into two compressors on the gas side, two oil pumps for the oil and two water pumps for the water. The capacities of these equipment remain constant over the system life, but the flows of oil, gas and water changes. This results in the capacities relative to the total flow of the parallel equipment for each stream changes over time. Failure of one oil pumps in year 1 has a higher impact on the system than failures of the oil pumps in year 3, because the oil production level has decreased. Conversely, a failure of one water pump in the first year hasn’t got an impact on the system at all (2*100%), but on the third year the separator needs to be slowed down to 50% as the water flow has increased with time. This composition tracking is very powerful when assessing the performance of upstream systems where separation processes are dominant. As the Maros flow network is limited to a converging setup, it is not possible to diverge the flow into multiple yields that are treated separately.
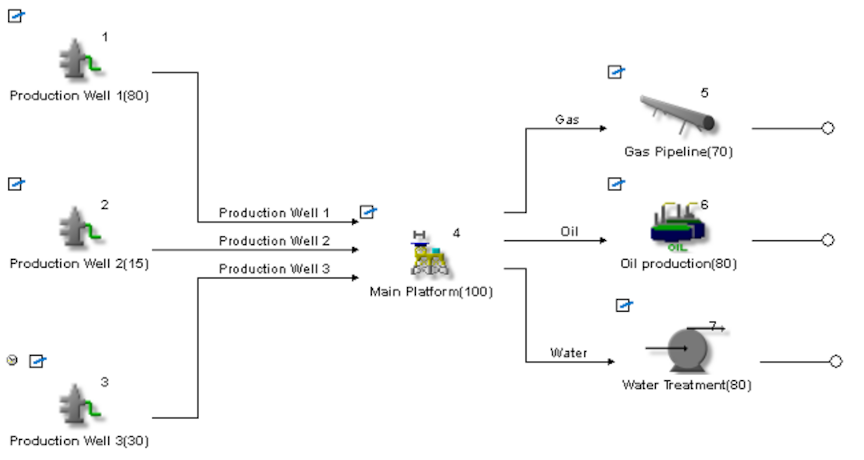
Block Flow Diagram in Maros
Taro flow network
A Taro flow network is set up with nodes representing processes/entities where the flow is routed to/through where it can converge, diverge or be treated in a specific way (e.g. buffer or bulk transport). A mass balance is kept between inflow and outflow through a sub-network, but the composition of the inflow from different sources is lost. This means that there is no composition tracking in a Taro network and that the type of analysis exemplified in the Maros flow network example above would be difficult to set up. On the other hand, the outflow from a node can be split into multiple yields feeding into downstream nodes, which allows it to model multiple stages of refining and even recycle loops where the outflow is linked back to an upstream point via a buffer. By setting priorities and blending rules to the inflow and outflow of the node, it is possible to set up very elaborate rule sets for how the flows are routed through the flow network.
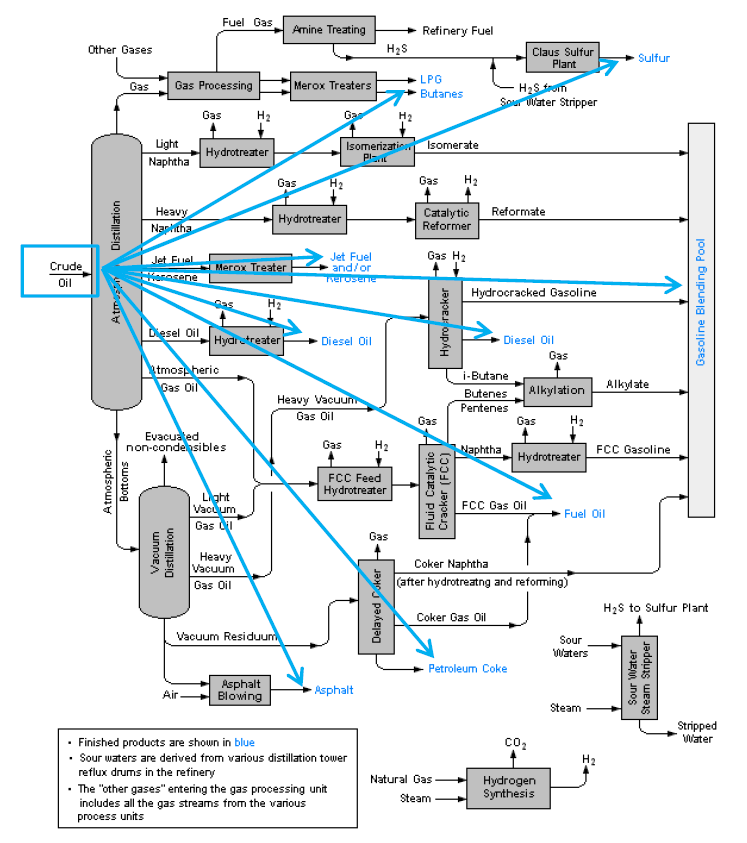
Example of Process schematic for a Refinery
Results
Maros and Taro produces a number of results, the next section explain the basic parameters.
Maro
Production efficiency (or Production Availability) is used to evaluate the performance of an upstream asset system. Rather than just giving you information about uptime vs downtime, production efficiency keeps track of how much product the system has actually lost throughout its life. Production efficiency accounts for degraded states of failure which is not cover for traditional calculation of availability – you cannot say that the system is half available but you could say that the system has lost half its production capacity (50% of loss in terms of production volume). Combined with time varying flow from multiple sources, this becomes a very powerful metric.
Equipment criticality allows you to identify the most loss-making pieces of equipment or scheduled activities that the system holds. It will typically identify equipment that fails often and has long repair times in places where the flow is high.
The results are depends on the features being used. For example, if you use flaring in your model, there will be a Flaring Operations report detailing the impact of the Flaring Operations on production. If there is a buffer in the model, there will be a buffer report showing levels of the content of the buffer throughout the system life and probabilities of having certain levels in the buffer.
Taro
Many different graphs and reports can be generated in Taro, depending on the degree of detail in the analysis. The key results are:
- Availability (measure of how often something breaks inside the individual unit), Normal Utilisation (how much the normal flow is through the unit divided with the max capacity) and Actual Utilisation (measure of how often there is downtime or reduced flow through the unit as a result of things
- breaking/re-routing through the whole system, i.e. not only in the individual unit), for each Node with the Maximum Capacities
- In this context, the Production Efficiency, which tells you how close you are to maximum production (defined as fraction of the capacity of the export nodes) might not be the main KPI.
- The real production volumes – these are split down to individual products as well if it is a refining model.
These tend to be key results in multi-unit refinery models analysed.
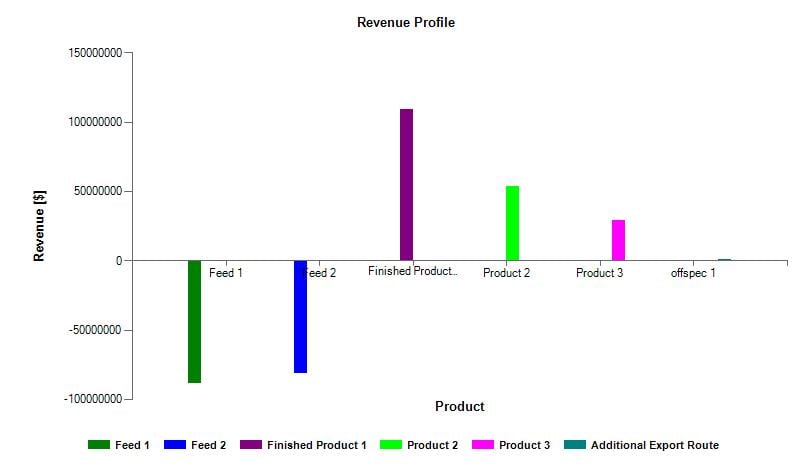
Revenue profile

Stream flow analysis
Author: Victor Borges
7/5/2016 10:36:46 PM