SCADA data analysis for solar energy projects
How much is it worth?
Many of us in the renewable energy industry are familiar with the use of SCADA (supervisory control and data acquisition) data to provide status updates on the operation of wind farms. The potential value of this data is well understood. From determining whether noise modes have been correctly applied to understanding the effects of icing, SCADA data is a vital part of the performance analysis of an energy yield assessment. But these are complex machines. In a lecture I attended in 2015, wind turbines were described as the largest continuously rotating machines that humans have so far devised. Since then, they have grown even larger. It is easy to understand the usefulness of knowing what the moving systems are doing in these complex machines.
Solar on the other hand is not quite so dynamic and therefore, requires a different approach. Additionally, the pace of new project development is much more rapid. We often see owners and operators having to balance the optimization of existing project operations with the race to identify and build new solar plants, with the rush to build new plant often winning. This means that operators can be reluctant to invest time to fully use SCADA data. Periodic reviews are often limited to monthly PR (performance ratio – an efficiency metric for solar projects) statistics, irradiance and energy, with a token look at the temperature, current or voltages. Afterall, if something goes wrong in most of the solar parks in the UK, it’s not like you can change the tilt angle or move the panels to a better position. There are no deep dive requirements to investigate the data that is being recorded – or are there?
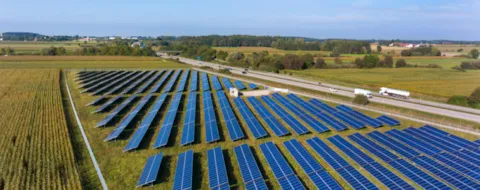
Recently, we were asked to investigate a UK solar park showing under-performance compared to budget in the summer months. The site was located near some potential shading, had narrow inter row spacing and a large enough DC/AC ratio to expect the inverter rating would limit output during periods of high insolation. These had all been included in the site’s budget assumptions, but even so, the site was showing 10% poorer performance then budgeted during the summer months.
We performed a simple investigation of the site using SolarWindFisher, DNV’s tool to visualize and analyse SCADA data. Independently calculating the various metrics, we were immediately able to confirm the reduction of the PR in the summer months. Then using the inverter level data, we were also able to identify the times when inverter clipping was happening and calculate the energy losses. Using the string level data, we were also able to separate the inter row shading and the external shading and again, calculate the associated energy losses. This data was compared to the budget calculations which suggested that there was less shading than expected. However, clipping was as per the budget assumptions, even during this particular year which was sunnier than the average. This was not enough to explain the poor performance.
Further investigations showed that there were performance issues with half of the inverters. These inverters were operating around 2% below their nominal efficiency and well below the efficiency of neighbouring invertors. We were close, but further analysis was still needed.
The next step was to look at the seasonal profile of the inverter response and compare this to the string response. We were able to look at the response of individual inverters to irradiance which all showed an approximate 10% reduction in performance during the summer months. This was the same dip in production that the site was seeing but it was not observed in the string response.
With these findings, we were able to give our customer enough diagnostic information to take to the inverter manufacturer and request for remedial works on the inverters to fix the suspected overheating, as well as the underperformance of half of their inverters. Prior to this investigation, the only option that the customer had considered was to reduce the budget for the site by about 5% and a corresponding loss of income. So the next time someone says you don’t have time to explore and get valuable insights from your SCADA data, think again, and ask yourself “do I feel lucky?”…
Learn how DNV can help operators to get the most out of their solar plant.
6/9/2020 3:00:00 PM
