Increasing the acceptance of remote sensing devices in complex flow conditions
What are the advantages of remote sensing devices and how can they deliver bankable wind speed measurements in complex terrain?
Remote sensing devices – advantages and drawbacks compared to masts
One of the key steps in the development of a wind project is understanding the wind resource and the potential for energy production. This is usually done by running a measurement campaign. Historically, this has relied on meteorological masts, but in recent years remote sensing has started to be incorporated.
Some of the advantages of remote sensing devices (RSDs), such as lidar and sodar vertical profilers, make them an attractive alternative to measure the wind climate up to heights well above the hub height of modern turbines. RSDs can be deployed quickly, without the need for planning permission. Their installation is significantly less challenging than that of a tall mast, especially in difficult terrain and they minimize safety risks, as there’s no need for engineers to work at height. One of the key drivers for the increased deployment of RSDs has been their potential to reduce uncertainties and improve pre-construction energy forecasts for sites with relatively simple terrain, given that they reduce the need to make engineering assumptions and extrapolations.
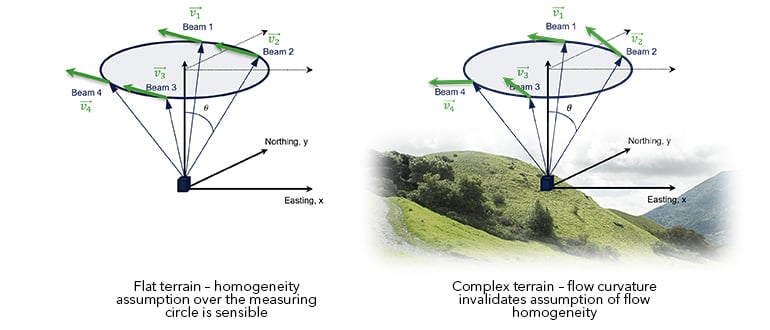
Despite their many advantages, the adoption of RSDs to measure the wind conditions in the context of a wind resource assessment (WRA) in complex flow conditions has been rather slow. Indeed, RSDs come with their own set of challenges; their power requirements are not trivial, and their calibration/verification is a more demanding exercise than the typical wind tunnel calibration. However, the main obstacles to widespread adoption of RSD measurements lie elsewhere. In complex terrain, the wind speed and turbulence intensity they return, by measuring over a large volume, can differ significantly from those measured by a point-like device that is a cup anemometer. This leads to increased measurement uncertainty. A large contributor to the mean wind speed uncertainty is the measurement principle behind all vertical profilers: since they rely on the Doppler effect, RSDs can only measure a wind speed along the line-of-sight (LOS) of the measuring beams. At any given height, the wind speed of interest (the horizontal wind speed above the device) is reconstructed from the measurement of at least three LOS wind speeds (along beams which are not colinear) and from the assumption that the flow conditions are homogeneous across the measurement circle.

Figure 1. Example of vertical profiler scanning geometry and effect of flow inhomogeneity
While this homogeneity assumption is a sensible one when the terrain is flat (and ground cover shows little variation), this is not warranted in complex flow conditions (Figure 1). The more the actual flow conditions vary across the measurement circle, in terms of wind direction or wind speed magnitude, the larger the systematic error on the reconstructed horizontal wind speed. The underlying reason this difference matters is because wind turbine power curves are based on point measurements, like those taken from cup anemometers. In simple terrain, it is fair to compare wind speeds from RSDs and anemometers – so using RSD wind speeds means you estimate the right power from the turbine. However, in complex terrain, if we are getting the wind speeds wrong using RSDs, this has an impact on our energy predictions.
So, does this mean that there is no hope for wind speed data from RSD in complex terrain to be useful in the context of an energy production assessment? Well… there is hope!
Simulation to the rescue
In recent years, the use of flow models, in particular computational fluid dynamics (CFD) models, has shown promise in deriving directional conversion factors that can be used to convert the RSD wind speed measurements, probed over a large volume, to point-like data, which then become comparable to cup anemometer data. To validate the approach and quantify the uncertainty benefits that can be obtained from CFD derived correction factors, DNV has initiated some internally funded research on the subject. This validation was done in a device agnostic way, based on data from 50 RSD/mast pairs distributed across a range of site conditions (with most of the sites showing at least moderate terrain complexity). Devices included 3 types of lidars (ZX, WindCube and Diabrezza), and 3 types of sodars (Triton, Fulcrum 3D and AQ), located in Europe, Asia, Australia, and North America.
The CFD solution, used for this validation exercise, is the heavily customized StarCCM+ RANS flow solver used by DNV as part of its CFD service for energy production assessments. To accurately capture the flow inhomogeneity across the RSD cone, particular attention is paid to the generation of good quality, highly resolved, prism meshes throughout the boundary layer, also using high resolution terrain/forestry maps. Simulations are carried out for site appropriate conditions and for as many directions as required to sufficiently cover the site wind rose. For any solved condition, the resulting CFD flow field is probed in a way that is consistent with how the actual flow field is probed by the RSD. The horizontal wind speed is then reconstructed using a device specific algorithm and compared with the simulated horizontal wind speed above the device, to yield a correction factor. The agreement between the cup anemometer and RSD measurement is then assessed, before and after CFD correction of the RSD data. The preliminary results from this research are summarized here.
As shown in Figure 2, the validation demonstrates that the CFD based RSD correction leads to a statistically good improvement in the RSD/mast correlations.

Figure 2. Effectiveness of CFD correction demonstrated by reduction in bias and standard deviation of a) relative difference between RSD and cup mean wind speed and b) departure from 1 for the slope of the RSD/mast wind speed correlation
After CFD correction (green), the difference in either mean wind speed between RSD and cup (left plot), or the departure of the slope of the regression from a value of 1 (right plot), are centred closer to a value of 0 than before CFD correction (blue). Also, the standard deviation of the distribution has been approximately halved by the CFD correction. Most RSD/cup pairs end up with mean wind speed differences within the typical 1%-2% uncertainty associated with cup anemometer measurements. So far, the RSD correction has been statistically effective on very complex and moderately complex terrain. Though despite the success, we still have three pairs of RSD/cup (out of 50) for which the application of the CFD correction degraded the agreement between RSD and cup. What these three cases show is that it can sometimes be difficult to decide which element of the triumvirate RSD, cup or CFD is at fault. In one of the cases, we suspect issues with anemometers. In another case, we question the accuracy of the RSD, due to the uncertainty assessed from an off-site calibration, and in the third case, the issue may be with either or all elements of the triumvirate. Since the size of the data set is still limited, it is not yet possible to detect trends and limitations with the applicability of the method with respect to site complexity classification.
RSD uncertainty
When evaluating the uncertainty of any RSD device, several uncertainty components are accounted for, including uncertainty from the device calibration, device classification, reference anemometer, device mounting, as well as uncertainty arising from surrounding terrain complexity. The terrain complexity element can vary significantly from site to site. This can be illustrated by comparing the magnitude of the directional correction factors, which can be quantified from simulations (Figure 3). A site with simple terrain (plot on the left), where the flow homogeneity across the RSD cone leads to correction factors within roughly 1% of a value of 1, will have a low complex terrain uncertainty. On the other hand, a device measuring on a site where the directional correction factors suggest a correction as large as 9% (plot on the right) will have a large complex terrain uncertainty attached to it (before CFD correction).

Figure 3. Examples of directional RSD correction factor derived from CFD for a) simple terrain site and b) very complex terrain site
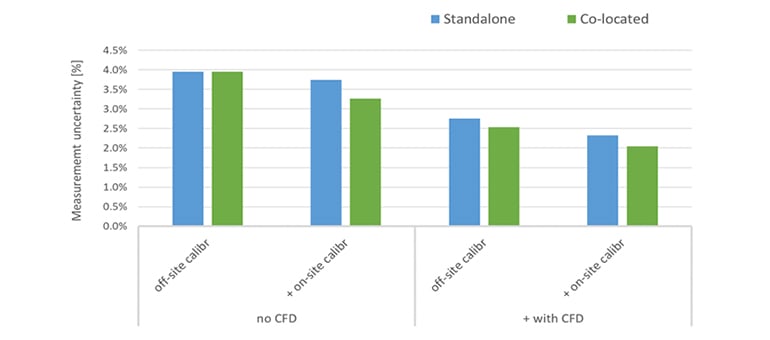
Thankfully, as demonstrated by the current validation exercise, the CFD correction can reduce the uncertainty arising from the flow complexity. From an assessment of device uncertainty across 6 sites with moderately complex terrain, we evaluated a range of scenarios, for devices with on/off-site calibration, with/without CFD correction. We found that, in the most favourable scenario, with on-site calibration and with CFD correction, the average device uncertainty is of the order of 2%-2.5%, compared to approximately 4% with off-site calibration, without CFD correction (see Figure 4). Whether this level of RSD uncertainty can be achieved all the time, also in very complex terrain, remains to be proven, by further evaluating such cases.

Figure 4. Examples of RSD device uncertainty for various deployment scenarios (standalone vs collocated with mast, with on-site vs off-site calibration, and with/without CFD correction). Uncertainty values averaged over 6 sites with moderately complex to complex terrain.
Are RSDs delivering bankable wind speed measurements in complex terrain?
The bankability of RSD wind speed measurements in complex terrain is ultimately a decision to be made by the banks. In my opinion, the current developments demonstrate that, in moderately complex terrain, RSDs can be a technically robust option for measurement campaigns, after having been first calibrated against an existing mast and CFD-corrected. Their subsequent deployment, standalone, some distance away from the mast allows a reduction of the horizontal uncertainty of the wind resource assessment. From ongoing investigations, we estimate that it is reasonable to expect that the addition of an RSD (with CFD correction) to a measurement campaign can increase the project P90/P50 ratio by 1% point.
In moderately complex terrain, the CFD evaluation of correction factors close to 1 for all directions also provides confidence that a standalone RSD can be deployed to measure the wind speed distribution of a site with good accuracy. In such conditions, the uncertainty associated with the RSD measurement is typically only slightly higher than that of a mast.
While additional analyses are required to better establish the limits and applicability of the CFD correction for RSD data, to help better understand what defines site complexity (in terms of terrain, variable ground cover or atmospheric conditions), we can already conclude that the use of a carefully set up, well validated CFD model can help increasing the acceptance of RSD in the context of a wind resource assessment.
About DNV
DNV offers an advanced CFD based approach which facilitates the increased use of Remote Sensing devices in non-simple flow conditions. Learn more about this service.
6/20/2022 8:00:00 AM
