Batch Hydraulic Analysis

Paul Cutting explains how Synergi Pipeline’s multi-tenant cloud web applications leverage cloud-scale batch hydraulic analysis to enable faster decision making with higher fidelity and increased confidence.
Batch hydraulic analysis enables Synergi Pipeline’s multi-tenant cloud web applications to leverage the power of the cloud, making studies that would have previously taken months of manual effort to be completed automatically in hours, or even minutes. In this blog post, Paul Cutting explains how these applications leverage cloud-scale batch hydraulic analysis to enable faster decision making with higher fidelity and increased confidence. Paul, who is based in our Mechanicsburg, Pennsylvania office, is a Principal Lead Software Architect for DNV’s Pipeline Solutions Portfolio.
The scenario
Let's suppose you have a gas distribution system with 1,000 regulator stations. Using Synergi Gas, you want to simulate what might happen should a regulator station fail wide open (in other words, simulate an overpressure event). You're interested in determining the following for each regulator station:
- Whether any portion of the downstream system becomes overpressured.
- The maximum pressure observed and where it occurred.
- The total length of pipe subjected to overpressure.
- The total number of customers supplied by overpressured pipes.
- Some relative measure of the level of overpressurization so that one regulator station can be compared with another.
The workflow
What might that workflow look like for one regulator station? Perhaps something like the following:
- Find Synergi Gas model A.mdb on your network drive.
- Open the model in Synergi.
- Find regulator station RS1.
- Identify the downstream area fed by the station.
- Export out an exchange file of baseline pressures and flows.
- Edit the station, set its status to known, and utilization factor to 1.0.
- Run a steady state analysis.
- Export out an exchange file of modified pressures and flows.
- Compare the before and after results downstream of the station and determine:
- Nodes and pipes that have exceeded MAOP, and by how much.
- The number of customers in these areas.
- The total length of pipe overpressured.
- Anything else of interest. - Reload the model to reinitialize it.
Okay, now repeat this for each of the 1,000 regulator stations that you have in your system. Phew! That's a lot of work you say! Yes. Yes, it is.
Now ask yourself a few questions:
- How long do you think that would take you?
- How confident are you that you could do all that without making any mistakes along the way?
- How would you share the results of your study with others within your organization?
Evaluating the effort
Let's dig into those questions a bit.
Let's assume you're infallible and execute the process perfectly with no mistakes or do-overs. (If you've completed one of our training classes, we have total faith in your awesomeness!) Consider, perhaps optimistically, that each run takes ten minutes, assuming a reasonable sized model – which presumably it would be if it contains 1,000 regulator stations. That's 10,000 minutes, or about 167 hours. That's over four solid weeks of work, assuming you had nothing else to do. You always get to spend four weeks on something uninterrupted, right? Oh... you don't? Okay, so let's assume you get to spend half your time on it. We'll even throw in a little time for lunch and the occasional bio break. We're generous like that.
So far, we've only accounted for generating the raw results, and not for any time aggregating and comparing the results to draw insights from them, so let's throw in another couple of days for that. Okay, so now we're looking at about 4.5 or 5 weeks of your time, and a couple of months or so of calendar time, and this is still a very optimistic view of things.
To be totally fair, it's perhaps possible to automate some of this workflow using Synergi's scripting capabilities. But that isn't for the faint of heart and is quite an advanced topic. There would be significant trial and error to get it right, and a good bit of post-processing of the results required that would take some time and effort. You would also be constrained by the hardware that you're running on (typically your laptop), meaning stringing together a thousand simulations back-to-back is still going to take a significant amount of time. And your machine wouldn't be good for much else while all the number crunching is going on, impacting your ability to multi-task and work on something else.
Evaluating the cost
Now let's take our (optimistic) evaluation of the effort and translate it into a cost in dollars and cents. Salaries and benefits packages (total cost of compensation to your employer) differ widely of course based on a slew of different factors, but for the sake of discussion, let's pick a nice round number of $100,000 per year. So, five weeks’ worth of your time spent on this study equates to a cost of almost $10,000. If you need to run this study a couple of times per year, and/or repeat it annually, the costs only grow.
And then of course there is the opportunity cost, which is much harder to quantify. What else could you have been working on that was a better use of your time and skills?
The other viewpoint is that you might never attempt such a study at all because of the prohibitive amount of time that it would take. But that decision carries significant risk and must be evaluated carefully, because there is the potential for a HUGE price tag if something were to go seriously wrong (think of the 2018 Merrimack Valley overpressurization incident, which cost the utility $1.6 billion).
Uh-oh
Errr, sorry, I don't know how to break this to you, but I have some bad news. All that hard work you just did over the last couple of months running those 1,000 cases was based on a model that wasn't loaded correctly, therefore all your results are wrong and useless. Your toil has been in vain. You must repeat the exercise again with the correct loading conditions. Oh, and I still need the results by the end of the month, so you're going to be working 12-hour days and weekends for a while. Ouch!
The cloud
If only there were a better way than all this manual effort. Spoiler alert - there is! You totally didn't see that coming, did you?
The solution is to use "the cloud" and the essentially limitless computing power it offers. The cloud has completely revolutionized the way that enterprise software is developed and delivered and blown the roof off the limits of what software can do, offering tremendous benefits to application consumers that weren't possible or practical to provide before.
Batch compute at cloud scale
The benefits of the cloud are many-fold, but I'd like to focus on one of them germane to our scenario: batch compute. This refers to the ability to orchestrate and process many, many, many more computational workloads than you could ever hope to do on your work laptop, oftentimes with massive parallelism. This means you get results much faster, making you more efficient and facilitating rapid, critical business decision making with higher confidence.
Our overpressurization scenario as outlined above is inherently parallelizable, meaning the result of one simulation is wholly independent of another. This means we could theoretically run 1,000 simulations concurrently. So, if one case takes five minutes to process programmatically, we could actually run all 1,000 cases in five minutes, assuming we had 1,000 machines to run it on. That's exactly the kind of processing power and benefit that the cloud provides.
Now, in reality, it doesn't quite work out that way. The reason for that is partly technical, and partly due to cost. From the technical perspective, it takes some time to scale out the virtual machines (VMs) that run the hydraulic analyses, schedule the work, execute it, write the results to storage, and then scale the VMs back in at the end, amongst myriad other things that have to happen to make it all work reliably.
Oftentimes the compute capacity of a software system isn't infinitely scalable because other parts of the system become a bottleneck. For example, if so many VMs are producing results at the same time, the network infrastructure, messaging systems, or database may not have enough throughput to move the data and store it quickly enough, slowing things down or even introducing failures. These are the kinds of fun, behind-the-scenes problems that you never see, but our software development teams must architect and account for when producing scalable, enterprise software systems.
But wait, why do we have to scale the VMs out and in at all? Why not just have a huge pool of VMs sitting there, waiting to send parametric studies to? The answer, quite bluntly, is cost. Once a VM is provisioned, the meter starts running and you're paying for it, whether its CPU is pegged at 100%, or sitting completely idle. So clearly it is inefficient and not cost effective to have large numbers of compute resources idling for any length of time, which is why we scale out when they’re needed and scale back in when they’re not. This is not instantaneous and takes some time.
The way compute resources are typically charged for by cloud providers is on a consumption basis, measured in units of CPU-hours. So, if you have 1 VM running for 100 hours, or 100 VMs running for 1 hour, the cost is the same. This is how massive, on-demand computational parallelism can be achieved cost effectively. Of course, the type of VM also influences the cost. For example, an 8 CPU machine with 32 GB RAM is more expensive than a 1 CPU machine with 4 GB RAM.
Overpressurization and outage analysis applications
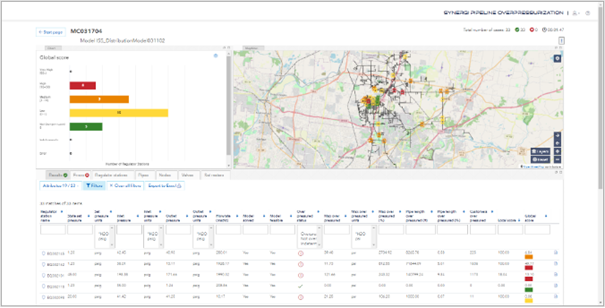
Amongst a broader portfolio of web-based, cloud-hosted, enterprise software-as-a-service (SaaS) solutions, DNV currently have two in private preview serving the gas distribution market: Overpressurization and Outage Analysis. The Overpressurization application does the exact scenario outlined at the beginning of this blog post, forcing a regulator station into the open position (simulating a failure) and assessing the subsequent downstream overpressurization. Outage Analysis does the inverse, where a regulator station is forced closed (simulating a failure, maintenance outage, and so on), and assessing the impact on supply.
Both applications leverage cloud-scale batch compute. There are many factors that will influence the specific performance that you may observe, but it's reasonable to assume that the overpressurization scenario outlined above could be completed in about an hour or so. Yes, you heard me right...
These applications can run 1,000 hydraulic simulations, aggregate all the results, and present them in rich, interactive tables and charts for comparison purposes and further insight, all within about an hour.
Not too shabby, eh? And this can be achieved at a small fraction of the cost of the equivalent manual approach. It's a repeatable process, and one that is not subject to human error. Being an enterprise, multi-user application, the results are also immediately available to other users without you having to lift a finger.
Parametric analysis applications
Both the Overpressurization and Outage Analysis applications are laser focused on a specific workflow, tailored and optimized to solve a specific problem. They are subsets of a more general category of analysis known as a parametric study, whereby the same data set is used across many simulations, with a small number of input parameters changed in each run to observe the effect.
Parametric studies are the kinds of problems that cloud-scale compute excels at solving, enabling previously time-prohibitive analyses to be completed in a fraction of the time.
We need your help!
Based on customer feedback, we prioritized Overpressurization and Outage Analysis as two parametric studies of high value to the industry. Rather than us guessing what you wanted, we engaged with customers and listened to feedback on your needs and priorities. This is rewarding for us because we get to build and deliver software that we know excites our customers, and you get an application that meets a business need.
What other kinds of parametric study, batch compute applications would you like to see us produce that would make your life easier or make you more efficient? Do you have any repetitive, time-consuming tasks that could benefit from this type of automation? If you have any ideas, we'd love to hear them! Please drop a note in the comment section below, contact software.support@dnv.com,or reach out to your favorite support engineer or salesperson with your suggestion.
Summary
By leveraging the power of the cloud, the impossible or impractical suddenly becomes feasible. Studies that would have previously taken months of manual effort can now be completed automatically in hours, or even minutes in some cases. This leads to faster decision making with higher fidelity and increased confidence in the conclusions drawn.
Your biggest challenge now is going to be figuring out what you’re going to do with all your newfound spare time when you have a cool cloud application that makes your life much easier.
Author: Paul Cutting
11/16/2021 3:44:19 PM