Electricity will be almost entirely non-fossil by 2060
3
%
Global AI electricity demand in 2040
Initial exponential AI growth will become more linear over time, reaching 11% electricity demand by 2060
44
%
Reduction in emissions from today to 2050
By 2060 emissions will reduce 63%
2.3
°C
Warming by 2100
Welcome to the 10th edition of our annual Energy Transition Outlook. One theme has remained constant over the past decade: we have argued consistently that faster electrification is the most powerful lever available to improve prosperity, strengthen energy security, and accelerate decarbonization. It should remain a priority for decision-makers across the public and private sectors.
Knut Ørbeck-Nilsen
Group President and CEO
DNV
10 years of forecasting: taking stock
Ten years ago, we set out to deliver an independent, 'most likely' forecast of the world’s energy future. We established a core team of system dynamics experts with the idea of grounding our forecasts in the experience of thousands of DNV engineers and professionals working with customers building the energy infrastructure of tomorrow.
How have we done so far?
We underestimated the pace of progress for solar PV and battery storage, while overestimating the speed of development for hydrogen and improvements in energy intensity. Many other developments were captured well. Our forecast for EV uptake was considered unusually ambitious in 2017, yet it closely matches the reality of today's market. Likewise, we correctly anticipated the overall pace of electrification.
The purpose of a forecast is not to predict every event correctly; our record so far nevertheless gives us confidence. The overall direction of the energy transition, and many of the forces driving it, has unfolded broadly as we anticipated.
Why forecasting still matters
AI makes it easier than ever to generate outlooks and scenarios, but that elevates questions of trust and makes transparency, methodology, and credibility even more important. Decision-makers need more than numbers; they need confidence in the assumptions, evidence, and reasoning behind them. An LLM can tell you what people believe will happen. Forecasting requires understanding why things happen.
A perfect forecast would never need updating. Reality, of course, has other plans. New information constantly emerges, policies change, and unexpected events (like the supply shock that the Iran war has set in train) occur.
Highlights
Energy exporters are maximizing their production to mitigate the shortfall of oil and gas from the Middle East, but most of the world is seeking to reduce or avoid fossil fuel dependence and prioritize strengthened supply security through renewables, nuclear, and energy efficiency.
Economic and job security considerations are reinforcing these trends, with countries increasingly prioritizing domestic energy, industrial preservation, and development. Energy exporters are supporting oil majors, national oil companies, and associated supplier industry, while importers are building clean technology industries for domestic deployment and export.
Over the last five years, the share of non-fossil energy in the primary energy mix has increased more than three times as much in energy-importing regions (2.2 percentage points across China, India, and Europe) as in energy-exporting regions (0.7 percentage points across the Middle East, North America, and Russia).
Global investments in renewables are surging with annual expenditure doubling over the last five years from USD 860bn in 2021 to USD 1,770bn in 2026.
The Iran war has further weakened the case for oil as a global export commodity and is causing permanent demand destruction.
The longer the conflict persists and energy prices remain elevated, the greater the resulting demand destruction for both oil and gas.
EV uptake in markets outside China, Europe, and the US has doubled over the past year.
Middle Eastern oil producers will see their future market share shrink. We forecast the region supplying around 40% of global oil production in 2050, down from 50% in our 2025 Outlook projection.
In a sensitivity study assuming the Middle East conflict persists until 2030, and oil and gas prices remain moderately elevated for those four years, we find a short-term reduction in demand of 4–6%
While the conflict lasts. We also find a permanent destruction of global oil and gas demand of 2–5% relative to our main forecast through the remainder of our forecast period.
In 2005, electricity represented 16% of global final energy demand. Today the share is 21%, and in 2045 we find the share will be 33%.
Electrification is driven by fossil-importing countries. Thus, in Europe, China, and India absolute electricity demand grows on average by 62% over the coming 20 years. However, fossil exporters are also electrifying due to its efficiency gains and cost advantages. In North America, the Middle East, and Russia, electricity increases by an average of 47% over the same period.
China is setting the pace for electrification, with electricity supplying 27% of its final energy demand today and exceeding 50% by 2060. It also has unrivalled manufacturing scale, producing more than 80% of solar modules and 95% of solar wafers.
In the next decade, North America accounts for 40% of global AI energy demand, while China follows as the second major growth centre. However, the main driver of growing electricity demand from today to 2040 will be space cooling (22%) and EV charging (21%), followed by data centres, including AI (18%).
Improved pricing, tariffs, infrastructure, and market design are main priorities to integrate variable renewables in the energy system.
Batteries are consistently outperforming all mainstream forecasts, with installed capacity increasing 14-fold over the past five years.
Neither transmission capacity nor demand flexibility are growing fast enough. While expanding transmission capacity takes time, demand flexibility can deliver significant benefits in the near term.
Gas remains critical for balancing the grid, even as its share of generation falls from 23% to 8% by 2050. Its average capacity factor (utilization) declines throughout our forecast period.
Hybrid threats, including cyber attacks, are emerging risks for energy systems. Greater reliance on electricity increases vulnerability to disruptions, but expanding interconnection, storage, and distributed generation can also enhance system resilience.
Renewable energy is seen as low risk with lower cost of capital (CoC) than fossil sources in all regions except the Middle East and Russia. The CoC advantage for renewables over fossil fuels widens from 1 to 5 percentage points relative to oil and gas, and from 4 to 8 percentage points relative to coal.
Solar PV and onshore wind are low-cost sources displacing fossil fuels from power generation in a growing number of countries. Fossil-fired power generation peaked globally last year and has now started to decline in absolute terms.
EVs are increasingly competitive with internal combustion engines. Commercial EVs are advancing rapidly and are now only five years behind passenger EVs in terms of share of new vehicle sales.
Early-stage technologies essential to decarbonizing the hard-to-electrify sectors are being given lower priority due to high costs and concerns about industrial competitiveness. Compared with ETO 2025, we have reduced the amount of hydrogen and CCS in our long term (2060) forecast by 29% and 15% respectively. Policy support is needed if cost gaps are to be overcome.
Nuclear is an exception to this cost-driven divide. It retains its present share of power production as electrification accelerates despite high costs and supply chain risks. Capacity will grow 30% in the next decade and 170% to 2060. Small modular reactors only become competitive with large-scale nuclear around 2040 in most regions; their share of nuclear generation grows rapidly thereafter.
Energy-related CO2 emissions reduce 44% from 39 Gt today to 22 Gt in 2050. Power emissions lead with a 60% reduction, followed by manufacturing (45%) and transport (34%), while buildings and process emissions are lagging.
Net-zero emissions are delayed until the 2090s, and this milestone is very uncertain and based on technologies like direct air capture that have yet to be deployed at scale, and on uncertain developments in land use changes.
The world is heading for 2.3°C of warming based on current IPCC climate sensitivity. New global warming records increasingly indicate that this climate sensitivity is on the low side and that there is a heightened risk of greater warming. Still, neither the most optimistic nor the most pessimistic IPCC scenario now appears likely.
Renewed climate ambitions are needed as limiting global warming to 1.5°C is now effectively unattainable. The goal of keeping warming well below 2°C is still attainable but requires stronger commitments.
Energy supply and demand
Supply
For generations, fossil energy has provided a constant 80% share of primary energy globally. By 2050, the fossil share falls to 51% of global primary energy, and to 40% in energy-importing regions like Greater China, Europe, and OECD Pacific as they move fastest to replace fuel imports with domestic renewables.
Oil demand recovers to around 170 EJ by 2028 from 163 EJ in 2026, then falls to 83 EJ by 2060.
Gas demand peaks around 2035 at 191 EJ, five years earlier than last year's Outlook, as importers diversify away from vulnerable supply routes. However, the longer-term decline of gas is slower than previously forecast, as hydrogen scale-up proves costlier and gas continues to displace coal in manufacturing. Gas still accounts for over 20% of primary energy in 2060.
The steady decline of coal is arrested this year as Asian utilities burn an estimated 70–90 million extra tonnes to cover for scarce gas. Its decline resumes in 2027, falling 82% to 30 EJ by 2060, when it will represent less than 5% of primary energy.
Demand
Demand for energy services continues to grow.
Demand for useful energy — the energy that directly delivers a service such as heating, lighting, or motion — will rise 23% from today to 2040 and another 10% to 2050. Buildings account for more than half of this additional demand. A variety of drivers explain this growth. Primarily, economic growth per capita leads to higher demand per person, particularly in emerging markets, and the global population will grow 20% by 2050. In addition, some energy demand categories are growing more than others, such as space cooling and AI data centres.
Final energy demand will plateau.
Energy supplied to the final user (i.e. the energy supplied to consumers' houses via the grid or cars via a petrol pump) constitutes 'final energy demand', which will only grow 8% until it plateaus in the 2030s and starts to decline.
The fact that useful energy demand continues to grow, while the final energy demand levels off is due to a gradually more efficient conversion of final energy to useful work. For instance, efficiencies increase 0.8 percentage points (pp)/yr in buildings and 0.6 pp/yr in transport and manufacturing.
Electrification drives efficiency gains.
Efficiency gains are strongly linked to increased electrification in all sectors. Electricity demand is surging, growing 80% by 2050. Transport, AI and data centres, and green fuel production (which demand little electricity today) make up half of the added demand.
Data centres and AI
Data centre and AI electricity demand grows fourteen-fold to 2060
We project global data centre electricity demand to increase to 1,100 TWh in 2030, 2,700 TWh in 2040, and 5,700 TWh in 2060, a fourteen-fold increase from today. As a result, data centres’ share of global electricity consumption increases from 1.2% today to 2.7% in 2030, and 6.8% in 2060. Over the same period, we expect IT power capacity to rise from 82 GW to 860 GW. AI workloads exceed all conventional data centre use from 2031, with inference rather than training accounting for the majority of AI demand, while the regional distribution of demand shifts away from North America throughout the period.
The pace of growth is set by access to firm power rather than by chip supply or capital availability.
Data centres consumed approximately 400 TWh of electricity in 2025, or 1.2% of global electricity supply. Capital expenditure by the world’s five largest technology companies exceeded USD 400bn in 2025 and is expected to rise by a further 75% in 2026, to approximately USD 700bn (IEA, 2026a). For comparison, global upstream oil and gas investment was USD 546bn in the same year (IEA, 2026c).
The investment focus is increasingly on physical assets, like semiconductors, buildings, cooling systems, and grid connections — and these are emerging as constraints on AI deployment, even as AI software advances at remarkable speed.
The AI energy demand forecast is among the most uncertain in our Outlook
Efficiency gains and rising use and growing computation per task pull demand in opposing directions, and uncertainty grows over the forecast period. New computing architectures or algorithms could change how much energy AI needs to deliver a given outcome, a shift our assumption ranges cannot capture.
Electrification
The energy transition is largely a story of electrification
As transport, buildings, and industry increasingly switch from direct fossil fuel use to electricity, global electricity demand doubles over our forecast period, growing much faster than overall energy demand. The shift is further reinforced by the emergence of new electricity-intensive applications, particularly data centres and hydrogen production. As a result, the energy transition becomes increasingly dependent on the ability to expand generation, grid infrastructure, storage, and system flexibility at unprecedented scale.
Buildings and transport are the main drivers of electricity demand growth
Rising populations, urbanization, and higher living standards increase buildings electricity consumption by 75% by 2060, excluding data centres. In transport, electrification is increasing rapidly through EVs: the global vehicle fleet will be 84% electric by 2060.
Overall global electricity generation rises from 33,000 TWh in 2025 to 84,000 TWh in 2060, an increase of 155%
This growth reflects both rapidly expanding electricity demand and the additional generation required to support storage, system flexibility, and transmission losses in a highly renewable power system.
In 2033, generation from wind and solar alone will be greater than from all fossil-fired plants
By 2060, solar and wind will supply 46% and 31% of electricity, respectively. By then, electricity demand will be 2.5 times greater than in 2025.
All regions, except North East Eurasia, will have less than 10% fossil generation in their electricity mix in 2060
Europe is already the region with the greenest electricity supply, and it will be 99% decarbonized from the mid-2050s.
Battery storage is now the fastest growing power capacity technology
Twice as much utility battery storage was installed in 2026 as in 2025.
Energy policy
The shift from climate-first to multi-objective policymaking is now firmly established: governments increasingly support technologies and infrastructure that simultaneously advance affordability, competitiveness, energy security, and decarbonization.
Policies that endure politically are those that strengthen sovereignty and domestic industry, reduce strategic dependencies, lower energy costs, and safeguard against climate and energy supply risks. As a result, resilience has become a guiding principle, replacing the debate between domestic cleantech production and lowest-cost imports with more balanced strategies.
Countries seek balance through supplier diversification and investment in domestic manufacturing of strategic technologies that align with national transition pathways. Renewable energy is central to energy security strategies because the sun and wind do not transit the Strait of Hormuz. However, policymakers are wary of replacing dependence on imported fossil fuels with reliance on imported cleantech equipment from concentrated supply chains, while also seeking domestic economic returns on public spending. As a result, local content rules, localization requirements, and trade measures are becoming more prominent, elevating strategic and political considerations alongside cost. This raises short-term costs in exchange for greater resilience, supply-chain security, and domestic value creation.
These multiple objectives contribute to a more fragmented global policy landscape. For energy companies, this means more complex projects, greater policy uncertainty, and a wider range of policy interventions driven by geopolitical and industrial priorities. In the ETO Model, technology selection is based on various factors, including cost, revenue, availability, utility, and policy. We incorporate geopolitical dynamics by adjusting key assumptions that include GDP growth, manufacturing footprints, regional technology costs, supply chain development, and the energy technologies and resources that regions are likely to prioritize.
Key energy policy trends
Climate policy for benefits beyond climate
While momentum on climate targets has slowed, climate action drivers remain strong and increasingly diverse. The IEA’s assessment of 2035 targets submitted through the 2025 nationally determined contributions (NDC) cycle found limited strengthening of near-term emissions reductions. Climate concerns have slipped behind immediate economic and geopolitical priorities, and global climate consensus has weakened. Decarbonization remains a strategic priority, but is increasingly tied to energy security, cleaner air, industrial competitiveness, and climate resilience. The EU’s carbon border adjustment mechanism (CBAM) is also driving climate policy and carbon pricing reforms among trading partners.
Deteriorating confidence in fossil fuel reliability strengthens the case for renewables
Successive energy shocks and disruptions at fossil fuel chokepoints have highlighted the risks of fossil fuel dependence, including price volatility and supply disruption. Europe’s exposure to Russian gas and Asia’s dependence on Middle Eastern energy imports have reinforced energy security concerns. As a result, policymakers increasingly view renewable energy as a means of delivering affordability, security, and sustainability, while improving domestic control over energy supply and reducing exposure to external price shocks.
Electrification policy gaining momentum, but delivery lags
Advances in electro-technologies and cheaper renewable electricity underpin electrification policy. The EU Electrification Plan, for example, sets an indicative target of 46% electrification (final energy demand) by 2040, up from 23% today, citing renewable deployment, efficiency, and electrification as drivers of strategic autonomy, lower energy costs, and competitiveness.
Business support is also strong: across 18 countries, 91% of companies say electrification improves energy security, 79% say geopolitical instability increases its urgency, and 90% aim to electrify operations by 2035 (Public First, 2026). However, underinvestment in grids, permitting delays, and limited support for upfront equipment replacement constrain progress.
With energy prices at around 25% above pre-Iran-war levels, governments are reintroducing subsidies and price controls after scaling them back since 2023. Rising inflation risks and weaker growth linked to the war are affecting economies unevenly; fossil exporters generally benefit, while importers face economic headwinds. In response, many countries are expanding fiscal relief measures. While these can shield consumers and businesses, they distort price signals, strain public finances, and delay efficiency improvements and structural reforms unless coupled with clear sunset provisions (IMF, 2026).
Transition policy diverges across regions
Policies are shaped by income levels, resource endowments, and economic priorities. Most high-income regions and China prioritize systemic decarbonization including in hard-to-abate and trade-exposed sectors through targeted support for emerging low-carbon alternatives and measures to reduce carbon leakage. By contrast, fossil fuel exporters, including the US, continue to support fossil fuel infrastructure and undermine climate action, recently seen in the delay of the Net-Zero Framework for shipping. Middle- and low-income regions prioritize affordable energy access, economic development, and infrastructure expansion, balancing decarbonization with broader socioeconomic needs. The favourable economics of solar and wind are accelerating renewable deployment in these regions and creating opportunities to leapfrog carbon-intensive energy additions.
Financing the transition
The energy transition is entering its most capital-intensive phase. Over the coming decades, the world must maintain and manage down the existing fossil energy system while building a new electricity-based system centred on renewables, grids, and storage. As investment shifts towards electrification, access to affordable capital will increasingly shape the pace of deployment across technologies and regions.
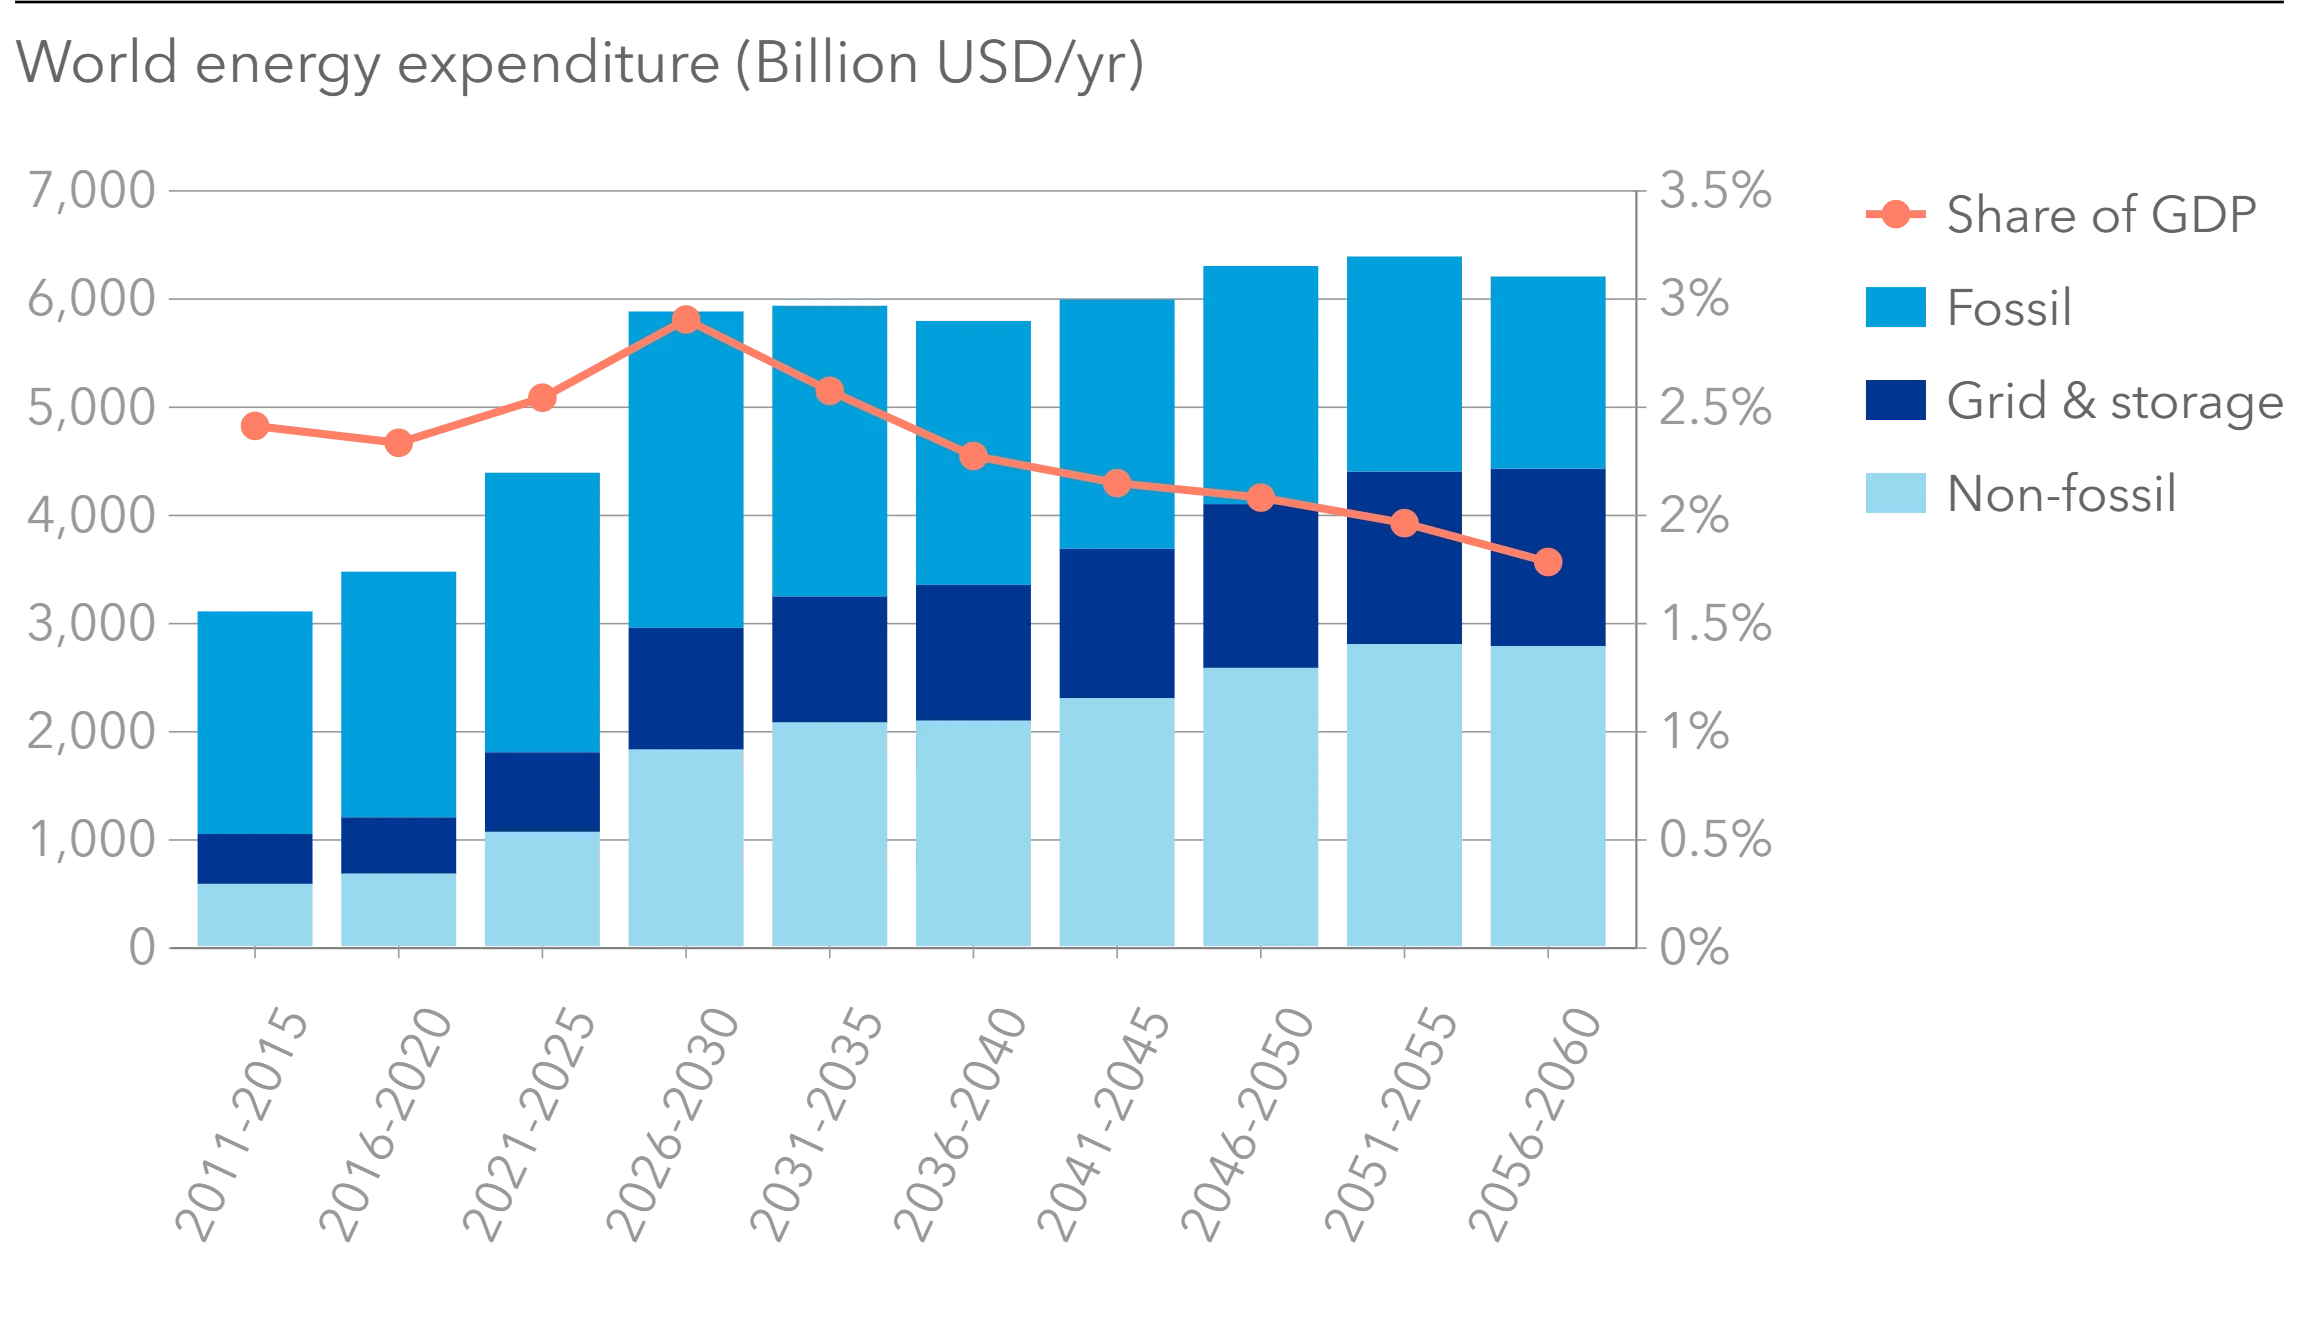
A temporary surge in expenditures …and delayed rewards
The 2020s and early 2030s represent the most expense-intensive stage of the transition. Society must finance an ageing fossil energy system and the rapid expansion of low-carbon infrastructure before the benefits of lower operating costs are fully realized. As a result, overall energy expenditure (including OPEX) rises during the build-out phase. Over time, however, lower operating costs offset higher upfront investment needs, and energy production expenditure becomes a smaller share of economic output as global GDP continues to grow.
That energy expenditure becomes an ever-smaller proportion of global GDP
during our forecast period is testament to the very low OPEX of the dominant technologies in the mid-century energy mix and the vast efficiencies enabled by electrification.
Electrification attracts most future capital
Investment in grid, storage, and renewable power will grow three-fold to 2040. CAPEX is shifting heavily from fuel supply towards electricity infrastructure. Solar becomes the largest destination for energy-sector investment, while spending on grids and storage grows steadily as electricity expands into transport, buildings, and industry.
Financing conditions determine transition speed
Technology performance alone will not determine the outcome of the transition. Financing costs — themselves a reflection of both technical and policy risk — influence technology competitiveness, deployment rates, and emissions reductions. Mature renewable technologies benefit from relatively low costs of capital, while emerging technologies such as hydrogen and CCS continue to face financing premiums. Regional differences remain significant, with higher financing costs slowing deployment in many lower-income economies. Reducing the cost of capital therefore remains one of the most effective levers for accelerating decarbonization.
Emissions and global warming
Energy-related CO2 emissions likely peaked in the last 24 months, and we forecast they will fall 65% to 12 Gt in 2060
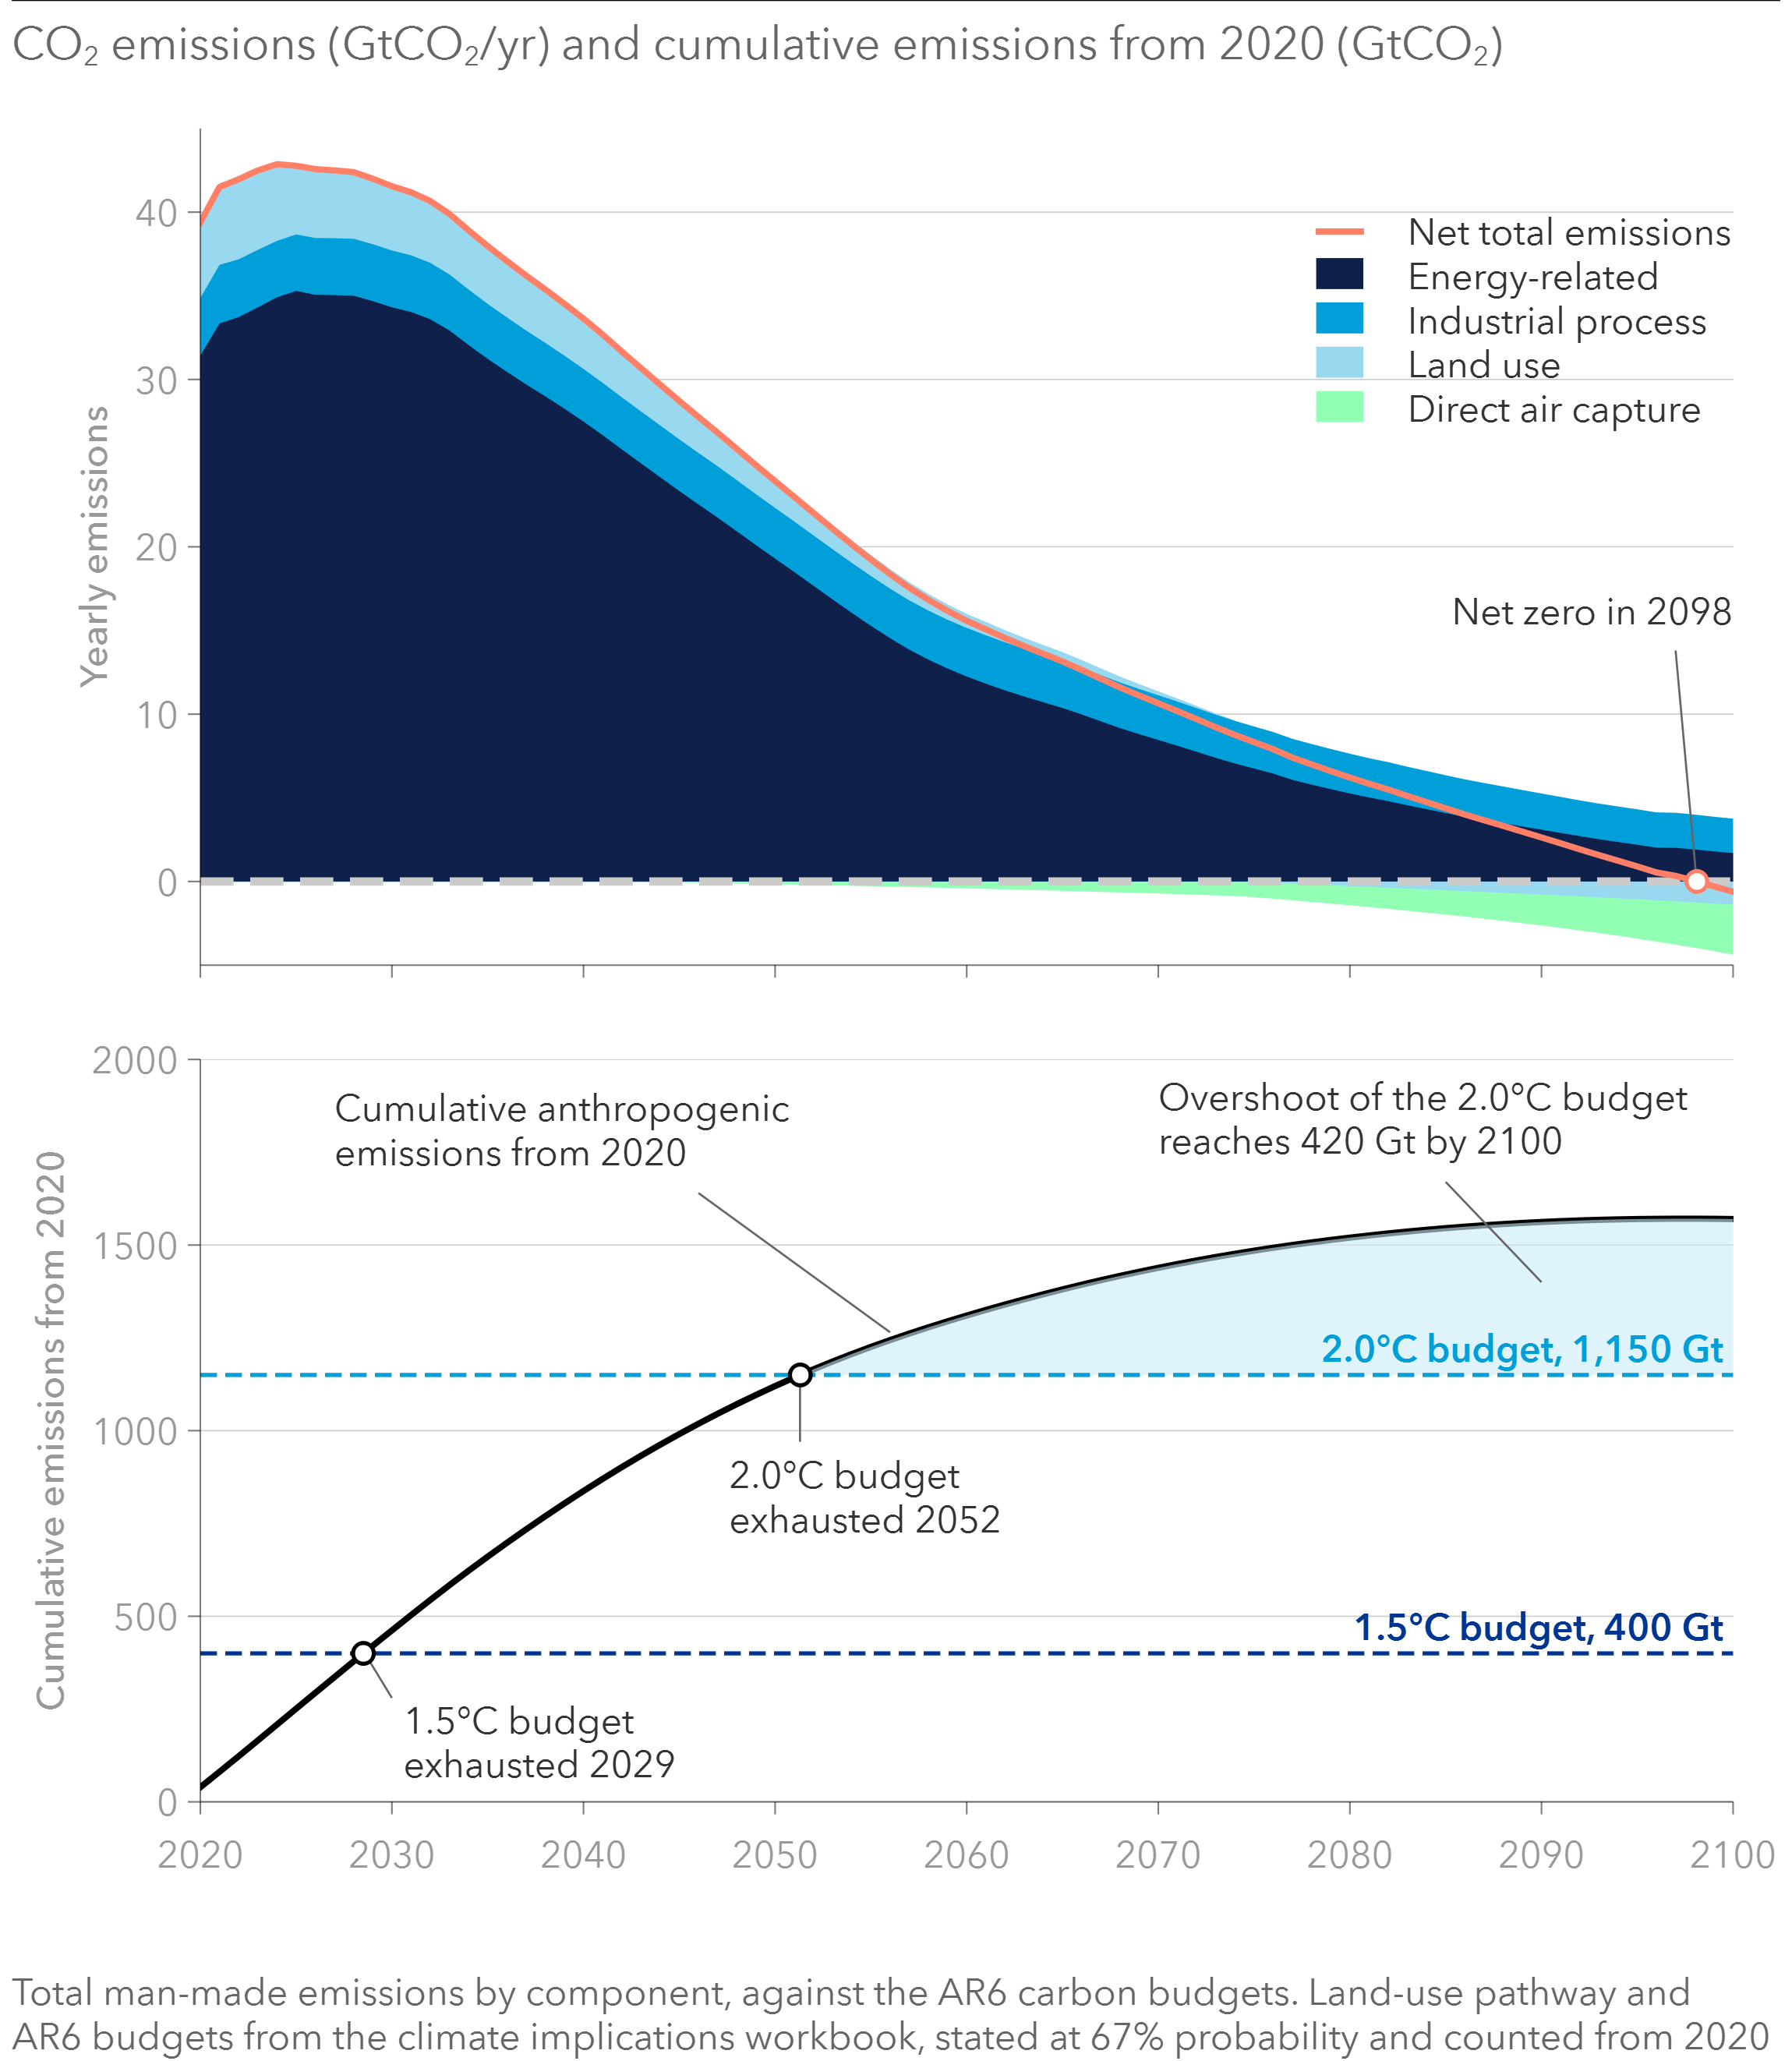
Total carbon dioxide emissions from human activities are comprised of emissions from energy use, industrial processes, and land use changes, minus the CO2 removed through direct air capture (DAC). These emissions peaked in 2024 at 43 Gt, but we project they will reach net zero emissions only in the final two or three years before the end of the century.
Transport is the most-emitting sector in 2060 at 4 Gt, ahead of the power sector at 3 GtCO2. Power emissions fall 82% over our forecast period compared with 56% for transport.
Emissions fall between 2025 and 2060 in nine of the ten ETO regions. Sub-Saharan Africa is the only region where emissions stay flat. North East Eurasia, Europe, North America, and OECD Pacific all reached peak emissions between 1980 and 2013. Sub-Saharan Africa gets there in 2050. Greater China will likely peak in the mid-2020s and falls by 79% to 2060.
Process emissions fall much more slowly than emissions from energy combustion by 2060 — 14% vs 65%. Process emissions arise from chemical processes rather than energy use. In cement production, for example, calcination releases CO2 from limestone independently of the kiln fuel. As a result, electrification and fuel switching offer limited opportunities for abating process emissions, contributing to their much slower decline.
Direct air capture (DAC) determines when net zero is reached rather than how quickly emissions fall. We expect DAC removal will be 0.4 GtCO2 in 2060, equivalent to 3% of energy and process emissions that year, and 3.0 Gt in 2100 against remaining emissions of 3.8 Gt.
Our forecast reaches net zero in 2098 resulting in end-century warming of 2.3°C. The 1.5°C budget is exhausted in 2029 and the 2.0°C budget in 2052. Cumulative emissions exceed the 2.0°C carbon budget by 420 Gt. After 2060, cumulative emissions (260 Gt) are 62% of the overshoot.
About the report
Now in its 10th edition, the Energy Transition Outlook (ETO) is DNV’s flagship report, presenting our forecast on how the world’s energy system will evolve through to 2060 both globally and in 10 world regions.
The ETO is a simulation-based forecast designed to project the most likely pathway for the global energy transition.
Rather than presenting an idealized, best-case scenario or a theoretical, cost-optimized solution, it models how the energy system actually behaves. It accounts for how different sectors interact over time, constrained by physical realities and driven by real-world decision-making.
A long-term, behaviourally-grounded forecast
The ETO Model simulates the global energy system from 1980 to 2100. This long horizon allows us to represent gradual structural change in technology, demand, supply, and investment. We simulate electricity dispatch hourly to capture grid flexibility and variability; other sectors run on weekly time steps.
Policy, timing, and constraints
We model policy as it exists in reality — through taxes, subsidies, mandates, and bans. The model includes delays where they matter: in planning, permitting, construction, and learning. It also captures limitations on how fast supply chains can ramp up, how quickly consumers can adopt new technologies, or how long assets stay in use. These frictions, often overlooked in simple models, are essential for understanding transition speed and direction.
Granularity where it matters
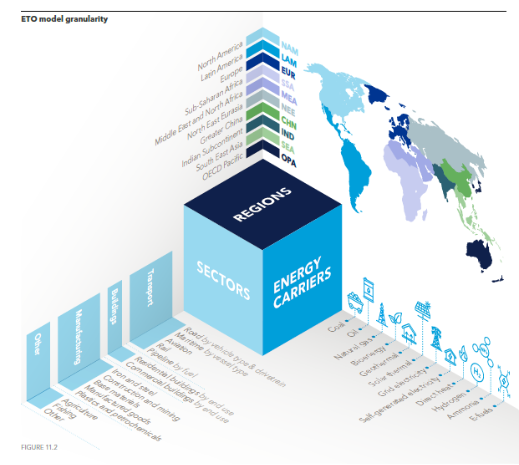
The model covers ten world regions, 12 energy carriers, and over 20 end-use sectors including transport, buildings, and manufacturing. This structure allows us to capture fuel switching, technology competition, and regional differences in cost, policy, and behaviour. It also reflects the energy used by whom, for what, and with which technology. This is critical to understanding system interactions.
Model updates for 2026
Successive editions of the ETO incorporate new insights, data, and modelling improvements. For 2026, model updates include new parameters for reflecting the short- and long-term impacts of the Iran war. We’ve enhanced our modelling of AI training and inference demand and introduced a new formulation for data centre power mixes. Our modelling of the hydrogen sector has undergone significant improvement (as described in our updated Hydrogen Outlook to 2060 released May 2026). Bioenergy modelling now includes increased granularity in feedstock types and regional supply potential. We’ve made several updates in our modelling of electricity generation, including introducing stricter firm capacity requirements. For the transport subsector, we revised the road vehicle driving distances and fuel economy inputs to better match available data.
Global Energy Transition Outlook 2025
Explore our flagship report: A global and regional forecast of the energy mix, supply, and demand to 2060