Operating a solar forecast under a penalty regime: what we've learned across multiple markets
By Harry Cheselwoods, Head of Go to Market

The operating conditions of your market, particularly the regulatory penalty regime, defines the risk threshold and consequences for forecasting error. Many markets are changing their forecasting standards and increasing the rigour required, through tighter error bands or increased penalties. As renewable share of market capacities increase, more operators are working under imbalance charges, capacity obligations or market-operator submission rules. The trend across these markets is consistent: as renewable generation share increases, operators will see higher penalties, tighter deviation bands, and a growing share of a plant's revenue decided by their ability to forecast.
Our work with customers spans dozens of forecasting regimes, from five-minute submissions to day-ahead forecasts. We support asset operators, grid operators and regulatory authorities, providing insight into how new regimes are designed, introduced and refined. we also work within forecasting arrangements established by market authorities, including DNV’s role as the centralised wind and solar forecast provider for New Zealand’s Electricity Authority.
What follows are the lessons that keep surfacing across those markets, together with the nuances that separate one regime from the next: what site adaptation changes and what it does not, how to use probabilistic forecast ranges such as P90, P75, P25 and P10, how to use curtailment and availability data together with your forecasts to improve penalty outcomes, and how PPA (Power Purchase Agreements) obligations, imbalance settlement and submission rules each reshape the operating job. The constant beneath all of them is straightforward: under any regime, the difference between forecast and delivery affects revenue and, ultimately, the operator’s P&L.
Why train your site model on operational data
For solar, training on a plant's own generation data is how a model learns the practical behaviour and operational realities that a theoretical power model forecast can’t capture. Inverter clipping caps the top of a sunny afternoon at a level set by the plant's DC:AC ratio, which a naïve forecast has no knowledge of. Complex or localised shading reduces production at a level of detail a typical pvlib model would not resolve. By combining the plant's SCADA and site measurements with multiple weather data sources and satellite-derived irradiance, the model learns the nuances of how local meteorological and physical effects translate into generation. Those nuances cannot be practically represented in a purely theoretical model. The result is a megawatt forecast tuned to the asset.
What site adaptation does not do matters as much as what it does, because this is where forecasts are most often oversold. It can’t correct when the weather forecasts are wrong: if the underlying weather model is wrong about tomorrow's weather, having trained on historical output cannot improve the model’s understanding of likely weather conditions, it can only reshape the relationship between forecast irradiance and power. It also does not remove uncertainty. Instead, it helps operators improve the confidence they can have in a forecast, because they know their forecast includes real operating conditions in their power model.
Using the P90–P10 range to size a bid, not a single point estimate
The value of uncertainty information lies in the decisions it enables. A central forecast provides an expected outcome, but not the likelihood of other plausible outcomes. Two forecasts can have the same expected generation while carrying very different levels of upside and downside risk. Probability bands make those differences visible, helping operators make decisions that reflect both the expected outcome and the risks around it.
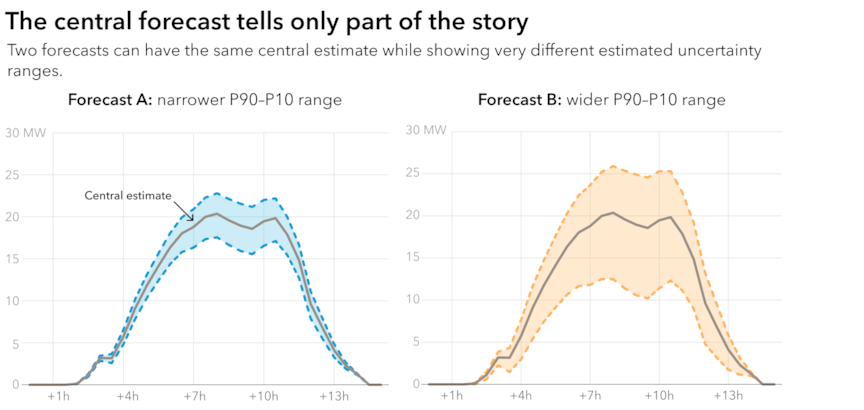
An operator who nominates based only on the central forecast bids identically on a more certain forecast and a more uncertain one. The probability bands make that difference visible, allowing the operator to account for the risk before deciding what to nominate.
A probabilistic forecast describes uncertainty using values with different probabilities of exceedance. P90 is a relatively conservative estimate with a 90% probability of being exceeded, while P10 is a higher estimate with only a 10% probability of being exceeded. The range between them shows the spread of plausible generation outcomes. P75 and P25 provide additional points within that range, allowing operators to make more nuanced decisions where the most conservative or most ambitious estimates do not match their commercial exposure. Read correctly, it allows operators to shape their forecast bids based on the risk different penalty outcomes, matching the forecast they use to their commercial exposure to forecast error. A risk-aware forecast approach means:
- Read the range, not only the central estimate. The central estimate is the best single estimate; The spread between P90 and P10 represents the forecast system’s estimated uncertainty for that interval. A narrow band and a wide band are different operating situations even when the central estimate is identical.
- Establish your risk asymmetry. Determine what an over-delivery costs relative to an under-delivery. In most markets, these are not symmetric. Also understand how the regime treats over- and under-delivery, and whether decisions made further ahead limit the positions available closer to delivery. Understanding these factors allows operators to match their power forecast to an acceptable risk range in their forecast bids.
- Select the percentile that matches your commercial exposure. In forecasting regimes that penalise shortfall more heavily, a more conservative forecast can protect against the expensive downside. P75 and P25 provide intermediate options where P90 or P10 are too conservative or too assertive for the exposure being managed.
- Size the bid accordingly, and re-size as the range narrows. The P90–P10 forecast range will often narrow between day-ahead and the final bid submission deadline as the forecast horizon shortens and newer observations become available.
All of this depends on the range being trustworthy. A percentile band is only as reliable as the forecasting system that produces it, from the underlying weather forecasts through to the way uncertainty is modelled and the power model. One factor that is often overlooked in training a power model, is not having clearly labelled generation gaps or restrictions from curtailment and availability.
Curtailment and availability: connecting plant conditions to the power forecast
A power measurement shows what the plant produced, but not necessarily what it was capable of producing. Lower output may reflect the weather, curtailment, reduced availability or genuine underperformance. Without additional plant data, a forecasting model cannot reliably distinguish between them.
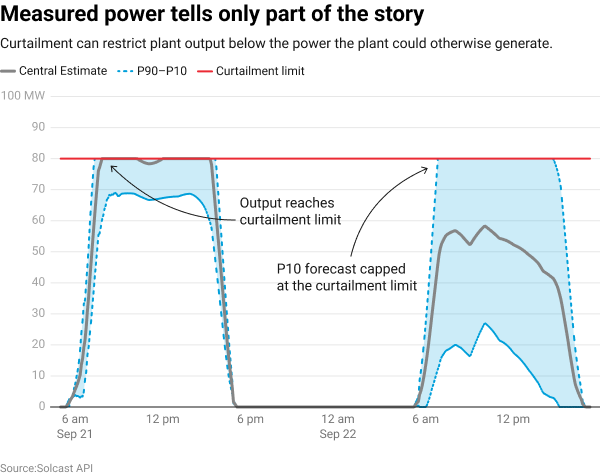
Curtailment and reduced-availability periods therefore need to be labelled or excluded from training data. Otherwise, the model may treat restricted production as normal plant behaviour and forecast too little power when similar conditions occur again.
The same information matters in real time. Short-term forecasts incorporating the most recent measurements can be distorted if those measurements reflect curtailment or reduced availability rather than the plant’s production potential. Providing expected curtailment and availability schedules allows the forecast to distinguish between the power the plant could generate and the restrictions currently limiting its output.
Persistent characteristics, such as long-term shading, belong in the site model. Temporary events, such as an outage or missed cleaning cycle, should not inadvertently become part of its understanding of normal plant performance.
How penalty regimes differ
The forecasting techniques described so far are broadly the same no matter where your plant operates. What changes between markets is what the forecast is measured against, and what an error costs. Across the markets we work in, these arrangements can be grouped into six broad, sometimes overlapping groups.
- System operator carries the imbalance. Under legacy feed-in tariffs and must-purchase schemes, the generator sells everything at a fixed price and the offtaker or consumer absorbs the imbalance. Forecasting is left to the system operator. Regimes like this these are gradually disappearing as support schemes expire and renewable penetration increases. Markets are increasingly shifting forecasting and balancing responsibility from system operators to generators and their trading counterparties.
- Market-priced imbalance settlement. In many European markets, the generator, or its aggregator, sits in a balance group, nominates a schedule and settles deviations at an imbalance price intended to reflect the real-time value of energy and the balancing actions required by the system. German TSOs describe this as a price rather than a penalty, and a deviation that happens to help the system can earn money as well as cost it. EU imbalance-settlement rules establish single pricing as the general approach, while allowing dual pricing under specified conditions. The cost of an error therefore depends on its size and on whether the system was in under-supply or over-supply at the time.
- Tolerance bands with escalating charges. The regulator sets tolerance bands around the schedule and charges more as the deviation moves into each wider band. These regimes tend to appear where there is no established balancing market to price imbalance, or where a regulator prefers to set the charges directly. Grids in India, China and Turkey all use versions of this approach, and the rules can differ even within one country. In China, there is no single national penalty formula: regional grids apply different forecast-accuracy requirements and assessment methods.
The exposure also depends on what error is measured against (available capacity, scheduled generation or installed capacity), whether plants are assessed individually or in aggregate, and whether over- and under-delivery are treated alike. Where under-forecasting is penalised more heavily than over-forecasting, nominating below the central forecast moves more of your misses onto the cheaper side. - Compliance with dispatch instructions. In centrally-dispatched markets, the plant's obligation is to follow the dispatch target issued by the system operator. The plant's forecast typically influences those targets through the available generation it reports to the operator. While the treatment of deviations differs between markets, exposure generally arises when actual output diverges from the dispatch instruction rather than from a forecast schedule or nominated position. Centrally dispatched markets including ERCOT, CAISO and AESO use versions of this arrangement, although the role of forecasts, dispatch instructions, tolerances and settlement differs materially between them.In these markets, accurate curtailment and availability data are a large part of managing that exposure.
- Cost allocation based on frequency impact. This approach allocates regulation reserve costs according to participants’ contribution to system frequency. In Australia’s National Electricity Market, Frequency Performance Payments replaced the former Causer Pays framework in 2025. The framework provides positive or negative payments depending on whether a facility’s deviations help or harm system frequency, while using those contributions to allocate regulation reserve costs.
- Additional incentives for forecast accuracy. Some markets add a direct accuracy incentive to their underlying market arrangements. In South Korea, renewable generators enrolled in the forecasting incentive programme receive an additional payment when their forecast error remains within a set threshold, with a higher payment for meeting a tighter threshold.
PPAs and tender documents add another layer of forecasting obligations, regardless of the market arrangements a project operates under. Availability guarantees and minimum generation commitments may carry their own charges for missed output, and contractual exposure can sometimes outweigh the regulatory exposure.
These arrangements often overlap. A solar farm in Great Britain may have its imbalance settled by its offtaker, with the cost passed back through its PPA. Responsibility for the forecast itself can also vary. In New Zealand, each wind and solar site receives a centrally procured forecast, but generators may use their own forecast if it meets the required performance standards. Operators therefore need to understand what they must submit, how deviations are treated and where the financial exposure ultimately sits.
Forecasting to the rules of your market
Each regime sets its own submission requirements, from forecast resolution and horizon to bid submission deadlines and how often a position can be revised. Meeting them takes forecast data that is reliable and arrives in time to act on.
The Solcast API issues updated forecasts every 5 to 15 minutes, using the latest satellite-derived irradiance and weather-model data. Forecasts extend from five minutes ahead to 14 days, at intervals ranging from five to 60 minutes. They can be trained on a site’s own measurements and incorporate curtailment and availability schedules. Selected plans also provide P90, P75, P25 and P10 probability-of-exceedance values alongside the central forecast. DNV provides solar and wind forecasts to asset operators and public bodies across a range of market arrangements. This includes serving as the centralised forecast provider procured by New Zealand’s Electricity Authority under its hybrid forecasting arrangement.