Seaborn trade outlook: the energy transition
The Energy Transition Outlook (ETO) model was developed by DNV GL to forecast the energy transition and its consequences in ten regions of the world on an annual basis. This approach reflects dynamics such as the growth and decline of the fossil-fuel trade over the coming decades. Key influential factors include decarbonization and electrification to drive the energy transition, new fossil fuel production methods such as hydraulic fracturing, increasing liquefaction of natural gas (LNG), regional shifts in fossil-fuel demand and supply, and geopolitical changes.
Modelling approach
In DNV GL’s demand-driven model, energy demand primarily depends on energy efficiency, population and GDP. Key energy users such as buildings, feedstock, manufacturing and transport are analyzed in detail.
The future energy supply will be largely influenced by the decarbonization push, helped by regional energy policies favouring some energy sources over others. Technology and the corresponding cost developments drive down the costs of all energy sources, while resource availability constraints might drive costs up. Differences between these cost developments help to determine the future mix of energy sources. The ETO model accounts for the uptake of a variety of technologies. It also looks at non-energy trade relevant to ship segments such as bulk and container carriers.
DNV GL sees global final energy demand peaking in 2033 at a level of 16% above today’s, then declining slowly. Energy supply will peak at around the same time, and consumption of thermal fuels will decrease, impacting maritime transport of coal and oil. Figure 1 illustrates the global forecast of the primary energy supply from fossil sources.
Maritime transport needs
Trade in crude oil is determined by differences between regional production and regional demand. On the supply side, DNV GL has modelled production capacity as a cost-driven global competition between regions. The balance between a region’s crude oil production and refinery input determines either the surplus available for export or a deficit to be covered by imports. The destinations of crude oil imports by sea are based on the most recent Automatic Identification System (AIS) data from crude oil tankers, adjusted for ballast movements. A similar approach was taken for shipments of oil products, with the demand for oil products and the refinery output as the determinants of regional trade.
To predict seaborne LNG and liquid petroleum gas (LPG) trade, the current share of gas transported by pipelines is deducted from the total trade volume. DNV GL first determined the portion of gas demand covered by each region’s own resources. Any supply shortfall is allocated to exporting regions according to their current shares as gas-trading partners.
Coal use is derived from parameters such as buildings, manufacturing and power generation. Each region’s hard-coal supply reflects its mining capacity, which expands as demand increases, and is limited by the reserves available locally. As in the case of natural gas, the study assumes a stable mix and shares of trade partners for coal. Regions with domestic shortfalls import coal from regions with surpluses.
Looking at non-energy trades, the ETO model incorporates regional manufacturing of finished goods (e.g. construction equipment, electronics, food, machinery and textiles) and the use of raw materials (e.g. chemicals, iron and steel, other metals, paper, pulp and wood) to produce them. Figure 2 shows the forecasted global manufacturing demand towards 2050.
Trade in iron ore is partially driven by base-material production. Global minor bulk trade is correlated with worldwide production of base materials such as metals, paper, steel and wood. The ETO study assumes that grain production dynamics will follow population and per-capita GDP growth of existing and potential grain-importing regions. Similarly, the study defines a relationship between container trade and the global supply of manufactured goods. A similar relationship exists between manufactured goods, production and other trades, including dry cargo unaccounted for in other categories.
Future trade will be influenced by emerging technologies, and digitization will have an impact on trade volumes and distances. Robotization will reduce the cost of labour, making relocation of manufacturing from high-labour-cost countries to emerging economies less attractive. This will reduce trading volumes, as a greater portion of manufacturing activities occurs close to market. Similarly, regional trade will increase, and average voyage distances will decrease.
Trade towards 2050
DNV GL forecasts a 39% rise in seaborne trade measured in tonnes over the 2016–2030 period, and a 2% rise for 2030–2050. Seaborne transport is projected to increase in all trade segments except crude oil and oil products, which should peak in around 2030.
In summary, traded tonnes and related tonne-mile shipping demand will both peak slightly within two to three decades. It could better be termed a plateau because the combined need for trade and maritime cargo will stabilize as trade in oil and coal decreases, while growth of other cargo slows in line with decelerating growth in both global population and GDP.
Bulk
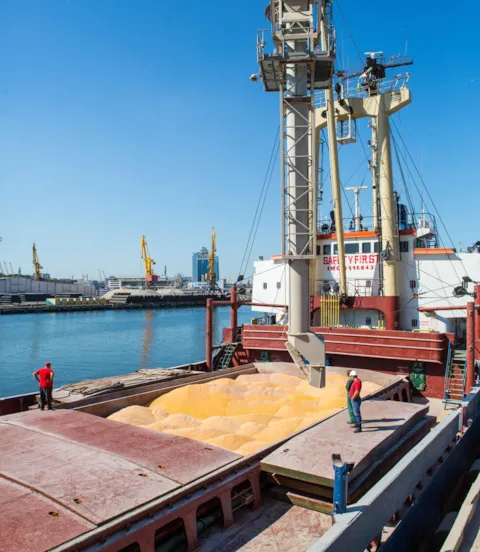
The ETO study distinguishes energy commodities from other cargo. Non-coal bulk, which includes grain, iron ore and minor bulk, dominates the picture, growing 2.8%/year until 2030, and 0.7%/year thereafter. Growth in iron ore and minor bulk trade will be solid for the first decades, then slow down. For iron ore, this growth will decline after 2030 due to the slower growth of base material output. Grain trade will continue to grow, although the pace of growth will reduce towards 2050.
Oil
The largest consumer of oil is transport, and oil demand is set to peak in the 2020s, then decline as vehicle electrification speeds up. Manufacturing is the second-largest consumer of oil. The use for feedstock will peak in the late 2020s. Seaborne crude oil trade will plateau some 21% higher than now within the next decade and trend down after 2027 to reach around 6.5 trillion tonne-miles in 2050. Trade in oil products will first level off and eventually decline.
Natural gas
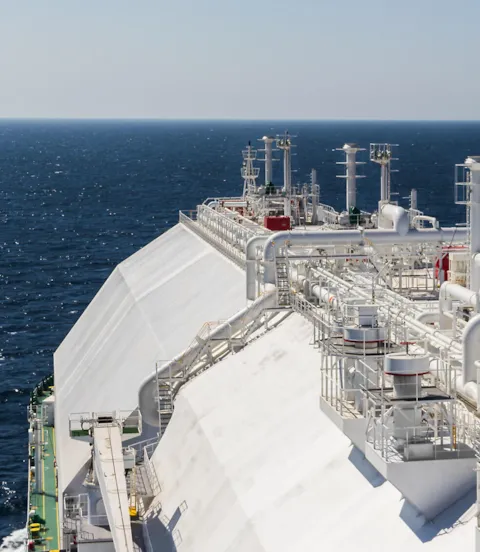
While gas consumption will peak in 2033 according to the DNV GL model, its use in manufacturing will increase throughout the forecast period until 2050. China will become the leading gas importer by 2021 and remain so for the rest of the forecasting period. Europe will remain a large gas importer, and the Indian Subcontinent and Sub-Saharan Africa will see growing imports. Trade in LNG and LPG will continue to increase. DNV GL predicts that the share of piped natural gas trade between countries will decrease to less than 50% by mid-century.
Containers
The trend to containerize commodities will likely continue. Container trade tonnage will broadly mimic manufacturing goods, increasing by 3.4%/year until 2030, and by 1.4%/year thereafter. Container trade growth will be highest in regions with the greatest growth in manufacturing output. China will dominate growth for another decade. Thereafter, the Indian Subcontinent will take over as the main growth region. Asian and African regions will play a greater role as economic growth moves south and east.
Other cargo and offshore shipping
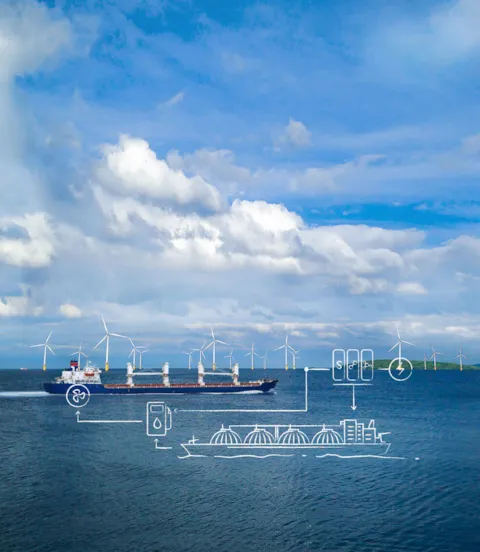
As some of the other cargo types, such as general cargo and most chemicals, move to containers, the segment will see annual growth rates decline towards 2050. A slow eastward shift in line with the growth of Asia’s share in the world economy is likely. Offshore shipping is expected to undergo significant change in the coming decades. While declining production of offshore oil and gas will reduce the need for related shipping, this will be compensated for, in part, by growth in other offshore segments such as wind energy.

Get regular maritime industry insights!
Join thousands of industry leaders today who have already signed up to receive the latest insights.
sign up