Select the statement you want to use and copy it to your own computer. Upon publication: use the reference as part of the statement and make use of the inserted link.
Hydrogen Forecast to 2050: graphs and pictures ↓
Topics
Hydrogen and energy demand - Hydrogen's contribution - Hydrogen production for energy - Hydrogen-based e-fuels - Hydrogen manufacturing - Hydrogen as an energy carrier - Hydrogen in buildings - Hydrogen supply - Transportation of hydrogen - Carbon-free gas - Off-grid solar for hydrogen - Electricity-based green hydrogen - Blue hydrogen - Global spend on producing hydrogen - Early uptake of hydrogen - Uptake of hydrogen by 2050
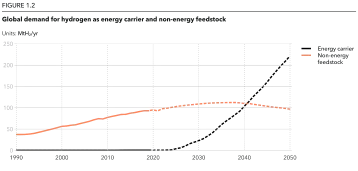
Hydrogen needs to cover some 15% of world energy demand by mid-century. Our projections indicate hydrogen will make up only 0.25% of the global final energy mix in 2030 and 3% in 2050, although the share of hydrogen in the energy mix of some world regions will be double these percentages.
(Source: DNV, 2023, Energy Transition Outlook) - All topics ↑
Although hydrogen's contribution to global energy demand is projected to reach only 3%, the developments in hydrogen technology and infrastructure over the next three decades will be significant.
(Source: DNV, 2023, Energy Transition Outlook) - All topics ↑
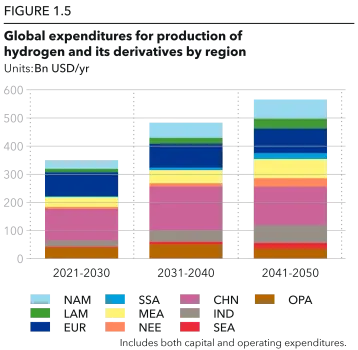
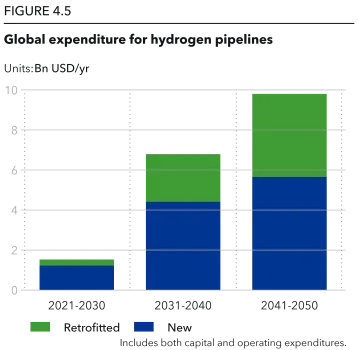
The estimated global expenditure on hydrogen production for energy purposes from now until 2050 is expected to reach USD 6.8 trillion, with an additional USD 180 billion allocated for hydrogen pipelines and USD 530 billion for the construction and operation of ammonia terminals.
(Source: DNV, 2023, Energy Transition Outlook) - All topics ↑
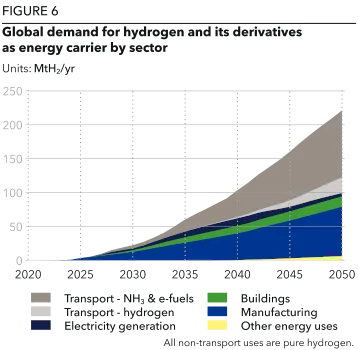
Together, pure hydrogen and hydrogen-based e-fuels are projected to constitute roughly 16% of aviation energy usage by 2050.
(Source: DNV, 2023, Energy Transition Outlook) - All topics ↑
In manufacturing, hydrogen use will experience gradual growth, reaching nearly 9 EJ/yr.
(Source: DNV, 2023, Energy Transition Outlook) - All topics ↑
About 6% of the total energy demand in manufacturing by then and 31% of the global demand for hydrogen as an energy carrier by 2050. The iron and steel industry will represent the largest portion of hydrogen demand in manufacturing, amounting to 3 EJ/yr or 37% of the total.
(Source: DNV, 2023, Energy Transition Outlook) - All topics ↑
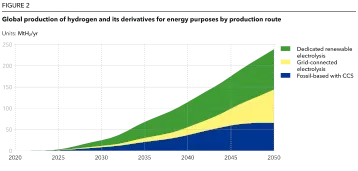
By 2050, an overwhelming 85% of the world's hydrogen supply will originate from low-carbon pathways. This breakdown is as follows: 28% will come from methane reforming with CCS, 15% from grid-connected electrolysis, 28% from dedicated solar-based electrolysis, 7% from dedicated wind-based electrolysis, and 2% from dedicated nuclear-based electrolysis.
(Source: DNV, 2023, Energy Transition Outlook) - All topics ↑
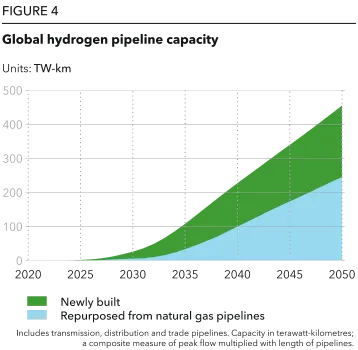
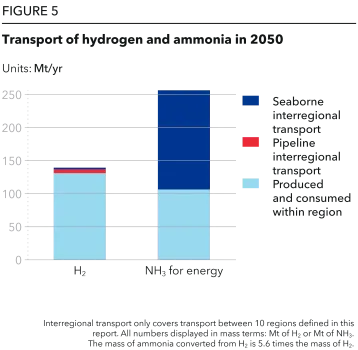
Hydrogen will primarily be transported via pipelines for medium distances within and between countries, but it's unlikely to be transported between continents by pipeline. Ammonia, being safer and more convenient for transport — especially by ship — is expected to account for 59% of energy-related ammonia trade between regions by 2050. DNV anticipates a 20-fold increase in ammonia seaborne transport from 2030 to 2050, totaling 150 million tonnes of shipments at that time.
(Source: DNV, 2023, Energy Transition Outlook) - All topics ↑
By mid-century, just 6% of gas will be carbon-free, of which hydrogen will supply roughly one quarter, with the balance made up through CCS in power and industry and by biomethane.
(Source: DNV, 2023, Energy Transition Outlook) - All topics ↑
By 2050, over 3 TW of off-grid solar will be dedicated to hydrogen production, mainly in Greater China (40%), Europe (26%), and North America (16%). A further 137 GW will be located in remote regions in Sub-Saharan Africa and the Indian Subcontinent, delivering life-changing electricity access for hundreds of millions of people.
(Source: DNV, 2023, Energy Transition Outlook) - All topics ↑
Electricity-based green hydrogen will account for 72% of production by 2050. This will require a surplus of renewable energy, to power an electrolyser capacity of 3,100 G – more than twice the total installed generation capacity of solar and wind in 2022.
(Source: DNV, 2022, Hydrogen Forecast to 2050) - All topics ↑
Blue hydrogen has a greater role to play in the shorter term (around 30% of total production in 2030), but its competitiveness will reduce as renewable energy capacity increases and prices drop.
(Source: DNV, 2022, Hydrogen Forecast to 2050) - All topics ↑
Global spend on producing hydrogen for energy purposes from now until 2050 will be USD 6.8tn, with an additional USD 180bn spent on hydrogen pipelines and USD 530bn on building and operating ammonia terminals.
(Source: DNV, 2022, Hydrogen Forecast to 2050) - All topics ↑
Early uptake of hydrogen will be led by hard-to-abate, high-heat manufacturing processes such as iron and steel production which currently use coal and natural gas. Hydrogen derivatives, such as ammonia and methanol, are key to decarbonizing heavy transport like shipping and aviation, but these fuels won’t scale until the 2030s.
(Source: DNV, 2022, Hydrogen Forecast to 2050) - All topics ↑
The uptake of hydrogen by 2050 will differ significantly by region, heavily influenced by policy:
- - Europe is the forerunner with hydrogen set to take 11% of the energy mix by 2050,
- - OECD Pacific (8%) and North America (7%) regions also have strategies, targets, and funding pushing the supply-side, but have lower carbon-prices and less concrete targets and policies.
- - Greater China (6%) follows on, recently providing more clarity on funding and hydrogen prospects towards 2035, coupled with an expanding national emissions trading scheme.
These four regions will together consume two-thirds of global hydrogen demand for energy purposes by 2050.
(Source: DNV, 2022, Hydrogen Forecast to 2050) - All topics ↑